

SFPUC Wholesale Customer Water Demand Projections ... - BAWSCA
SFPUC Wholesale Customer Water Demand Projections ... - BAWSCA
SFPUC Wholesale Customer Water Demand Projections ... - BAWSCA

Create successful ePaper yourself
Turn your PDF publications into a flip-book with our unique Google optimized e-Paper software.
Los Trancos Woods<br />
Northern, Blue Oaks, Vista Verde<br />
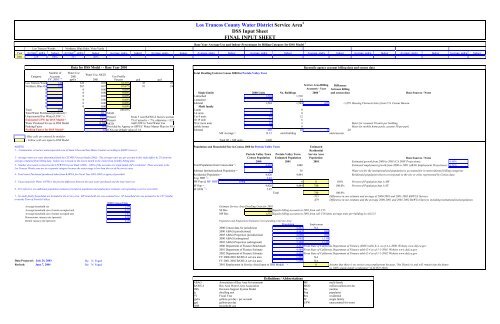
Los Trancos County <strong>Water</strong> District Service Area 1<br />
DSS Input Sheet<br />
FINAL INPUT SHEET<br />
Base Year Average Use and Indoor Percentages by Billing Category for DSS Model 2<br />
Year Average 9 , gpd/a Indoor Average 10 , gpd/a Indoor Average, gpd/a Indoor Average, gpd/a Indoor Average, gpd/a Indoor Average, gpd/a Indoor Average, gpd/a Indoor Average, gpd/a Indoor Average, gpd/a Indoor Average, gpd/a Indoor<br />
2001 228 66% 567 26%<br />
Number of<br />
Data for DSS Model - - Base Year 2001<br />
<strong>Water</strong> Use<br />
<strong>Water</strong> Use, MGD<br />
Category Accounts 2001<br />
Use Profile<br />
FY. 2001 3,8 gpd/a 2 2001 Percent gcd gcd<br />
Los Trancos Wood 140 228 0.03 32.33% 43 28<br />
Northern, Blue Oak 118 567 0.07 67.67% 91 24<br />
0 0 0.00 0.00%<br />
0 0 0.00 0.00%<br />
Total Dwelling Units in Census 2000 for Portola Valley Town<br />
Service Area Billing Difference<br />
Single family<br />
2000 Units<br />
No. Buildings<br />
2000 3 and census data<br />
Accounts - Year between billing<br />
0 0 0.00 0.00% 1-detached 1,510 1,510<br />
0 0 0.00 0.00% 1-attached 34 34<br />
0 0 0.00 0.00% Subtotal 1,544 1,544 265 -1,279<br />
0 0 0.00 0.00% Multi family<br />
Total 258 0.10 100.00% 2-units 0 0<br />
Total <strong>Water</strong> Purchased (produced) 4 = 0.11 MGD 3-4 units 0 0<br />
Unaccounted For <strong>Water</strong> (UFW) 5 = 6.6% Percent From 5 year BAWUA Survey average 5 to 9 units 84 12<br />
Estimated UFW for DSS Model = 7.0% Percent 7% if actual is < 7%, otherwise = E25 10-19 units 97 6<br />
<strong>Water</strong> Produced for use in DSS Model 0.106 MGD Add UFW to Total <strong>Water</strong> Use 20 or more units 84 2<br />
Peaking Factor NA Provided by Agency or <strong>SFPUC</strong> <strong>Water</strong> Master Plan (or NA) mobile homes 0 0<br />
Peaking Factor for DSS Model= 1.6 If NA use default value of 1.6. Subtotal 265 20 0 -20<br />
MF Average = 13.15 units/building units/account<br />
- Blue cells are entered by modeler<br />
- Yellow cells are input to DSS Model Total SF + MF units = 1,809<br />
NOTES<br />
1. - Communities served are unincorporated area of Santa Clara and San Mateo Counties according to BAWUA survey<br />
Population and Household Size in Census 2000 for Portola Valley Town Estimated<br />
Residential<br />
Portola Valley Town Portola Valley Town Service Area<br />
Census Population Estimated Population Population<br />
2 - Average water use water determined from the LTCWD Forecast Study (2002). The average water use per account in this study differs by 2% from the<br />
average computed from billing data. Indoor use is based on the lowest month in the winter from monthly billing data.<br />
3 - Number of accounts is based on the LTCWD Forecast Study (2002). 100% of the accounts are single family (SF) residential. Those accounts in the<br />
Los Trancos Woods zone are in a separate category because the water usage is low than the rest of the service area.<br />
4 - Total water Purchased (produced) taken from BAWUA for Fiscal Year 2001-2002 or agency if provided.<br />
5 - Unaccounted for <strong>Water</strong> (UFW) is the percent difference between the total water purchased and the total water use.<br />
6 - For reference see additional population estimates provided in population and employment estimates corresponding to service area table.<br />
7 - No multi-family households are included in the service area. MF household size was assumed zero. SF household size was assumed to be 2.87 (similar<br />
to nearby Town of Portola Valley).<br />
Reconcile agency account billing data and census data<br />
Data Sources / Notes<br />
2000 2001 2001 Estimated growth from 2000 to 2001 (CA DOF <strong>Projections</strong>): 0.40%<br />
Total Population from Census data 6 = 4,462 4480 Estimated employment growth from 2000 to 2001 (ABAG Employment <strong>Projections</strong>): 0.23%<br />
Subtract Institutionalized Population = 36 36 <strong>Water</strong> use for the institutionalized population is accounted for in nonresidential billing categories<br />
Residential Population = 4,426 4,444 Residential population shown corresponds to the city or cities represented by Census data<br />
Avg. HHS 7 = 2.45<br />
MF Pop @ MF HHS 7 0.00 0 0 0 0.0% Percent of Population that is MF<br />
SF Pop = 4,426 4,444 740 100.0% Percent of Population that is SF<br />
SF HHS 7 = 2.87<br />
Total 740 100.0%<br />
-515 Difference in our estimate and average of 2000-2001 and 2001-2002 BAWUA Surveys<br />
-479 Difference in our estimate and the average 2000-2001 and 2001-2002 BAWUA Surveys including institutionalized population<br />
2000 Census Data<br />
Average household size 2.58 Estimate Service Area Dwelling Units for 2001<br />
Average household size of owner-occupied unit 2.75 SF Res 258 Equals billing accounts in 2001 from cell C15<br />
Average household size of renter-occupied unit 1.67 MF Res 1,552 Equals billing accounts in 2001 from cell C16 times average units per building in cell L31<br />
Homeowner vacancy rate (percent) 0.20<br />
Rental vacancy rate (percent) 6.20 Population and Employment Estimates Corresponding to Service Area<br />
Housing Characteristics from U.S. Census Bureau<br />
Meter for assumed 50 units per building.<br />
Meter for mobile home parks, assume 50 per park.<br />
Data Sources / Notes<br />
Population<br />
Employment<br />
2000 Census data for jurisdiction 4,462 NA<br />
2000 ABAG (jurisdictional) 4,462 880<br />
2005 ABAG Projection (jurisdictional) 4,800 890<br />
2000 ABAG (subregional) 6,905 1,130<br />
2005 ABAG Projection (subregional) 7,300 1,140<br />
2000 Department of Finance Benchmark 4,462 From State of California Department of Finance (DOF) table E-4 as of 4-1-2000. Website www.dof.ca.gov<br />
2001 Department of Finance Estimate 4,480 From State of California Department of Finance table E-4 as of 1-1-2001. Website www.dof.ca.gov<br />
2002 Department of Finance Estimate 4,490 From State of California Department of Finance table E-4 as of 1-1-2002. Website www.dof.ca.gov<br />
FY 2000-2001 BAWUA service area 1,250 NA<br />
Data Prepared : July 24, 2003 By: N. Foged FY 2001-2002 BAWUA service area 1,260 NA<br />
Revised: June 7, 2004 By: N. Foged 2001 Employment in Service Area (input to DSS Model) = 0 Assume that there is no service area employment because, "the District is and will remain into the future<br />
as 100% single family residential." (LTCWD 2003).<br />
Definitions / Abbreviations<br />
ABAG Association of Bay Area Governments MF multi family<br />
BAWUA Bay Area <strong>Water</strong> Users Association MGD million gallons per day<br />
DSS Decision Support System Model No. number<br />
du dwelling unit Pop population<br />
FY Fiscal Year Res residential<br />
gpd/a gallons per day / per account SF single family<br />
gpd gallons per day UFW unaccounted for water<br />
HHS<br />
household size


