

SFPUC Wholesale Customer Water Demand Projections ... - BAWSCA
SFPUC Wholesale Customer Water Demand Projections ... - BAWSCA
SFPUC Wholesale Customer Water Demand Projections ... - BAWSCA

Create successful ePaper yourself
Turn your PDF publications into a flip-book with our unique Google optimized e-Paper software.
SECTIONFIVE<br />
<strong>Water</strong> <strong>Demand</strong> <strong>Projections</strong><br />
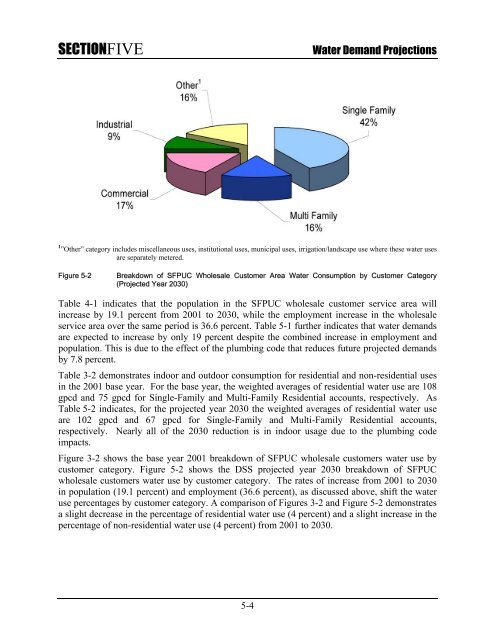
1 ”Other” category includes miscellaneous uses, institutional uses, municipal uses, irrigation/landscape use where these water uses<br />
are separately metered.<br />
Figure 5-2<br />
Breakdown of <strong>SFPUC</strong> <strong>Wholesale</strong> <strong>Customer</strong> Area <strong>Water</strong> Consumption by <strong>Customer</strong> Category<br />
(Projected Year 2030)<br />
Table 4-1 indicates that the population in the <strong>SFPUC</strong> wholesale customer service area will<br />
increase by 19.1 percent from 2001 to 2030, while the employment increase in the wholesale<br />
service area over the same period is 36.6 percent. Table 5-1 further indicates that water demands<br />
are expected to increase by only 19 percent despite the combined increase in employment and<br />
population. This is due to the effect of the plumbing code that reduces future projected demands<br />
by 7.8 percent.<br />
Table 3-2 demonstrates indoor and outdoor consumption for residential and non-residential uses<br />
in the 2001 base year. For the base year, the weighted averages of residential water use are 108<br />
gpcd and 75 gpcd for Single-Family and Multi-Family Residential accounts, respectively. As<br />
Table 5-2 indicates, for the projected year 2030 the weighted averages of residential water use<br />
are 102 gpcd and 67 gpcd for Single-Family and Multi-Family Residential accounts,<br />
respectively. Nearly all of the 2030 reduction is in indoor usage due to the plumbing code<br />
impacts.<br />
Figure 3-2 shows the base year 2001 breakdown of <strong>SFPUC</strong> wholesale customers water use by<br />
customer category. Figure 5-2 shows the DSS projected year 2030 breakdown of <strong>SFPUC</strong><br />
wholesale customers water use by customer category. The rates of increase from 2001 to 2030<br />
in population (19.1 percent) and employment (36.6 percent), as discussed above, shift the water<br />
use percentages by customer category. A comparison of Figures 3-2 and Figure 5-2 demonstrates<br />
a slight decrease in the percentage of residential water use (4 percent) and a slight increase in the<br />
percentage of non-residential water use (4 percent) from 2001 to 2030.<br />
5-4


