

SFPUC Wholesale Customer Water Demand Projections ... - BAWSCA
SFPUC Wholesale Customer Water Demand Projections ... - BAWSCA
SFPUC Wholesale Customer Water Demand Projections ... - BAWSCA

You also want an ePaper? Increase the reach of your titles
YUMPU automatically turns print PDFs into web optimized ePapers that Google loves.
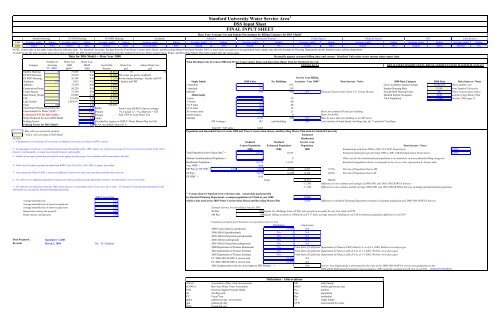
Stanford University <strong>Water</strong> Service Area 1<br />
DSS Input Sheet<br />
FINAL INPUT SHEET<br />
Base Year Average Use and Indoor Percentages by Billing Category for DSS Model 2<br />
Student Housing FS SFD Housing<br />
FS MFD Housing<br />
Academic<br />
Athletics<br />
Construction Projects<br />
Comm Spaces<br />
Medical School CEF<br />
Lake System<br />
Year Average, gpd/a Indoor Average, gpd/a Indoor Average, gpd/a Indoor Average, gpd/a Indoor Average, gpd/a Indoor Average, gpd/a Indoor Average, gpd/a Indoor Average, gpd/a Indoor Average, gpd/a Indoor Average, gpd/a Indoor<br />
2000 37665 70% 78678 36% 26784 62% 1812.061856 80% 75330 45% 50220 0% 75330 50% 87885 75% 552420 100% 1093911 0%<br />
NOTE: Census data in this table is provided for reference only. For Stanford University, the data from the Final <strong>Water</strong> Conservation, Reuse, and Recycling Master Plan dated October 2003, is much more accurate as it was generated from campus data directly through the Housing Department and the Stanford water utilities department.<br />
In order to use the most accurate and current data available, the DSS model includes information from this Stanford University <strong>Water</strong> Conservation, Reuse, and Recycling Master Plan report rather than the census data.<br />
Data for DSS Model - - Base Year 2000<br />
Reconcile agency account billing data and census / Stanford Univeristy water master plan report data<br />
Number of <strong>Water</strong> Use <strong>Water</strong> Use,<br />
Total Dwelling Units in Census 2000 and <strong>Water</strong> Conservation, Reuse and Recycling Master Plan for Stanford University<br />
Category Accounts 2000 MGD Use Profile <strong>Water</strong> Use Indoor <strong>Water</strong> Use<br />
CENSUS DATA<br />
2003 WATER CONSERVATION, REUSE AND RECYCLING MASTER PLAN DATA<br />
FY. 2000 3 gpd/a 2 2000 Percent gcd gcd<br />
Student Housing 18 37,665 0.68 18.81% 92 52<br />
FS SFD Housing 6 78,678 0.47 13.10% The water use gcd is combined<br />
FS MFD Housing 3 26,784 0.08 2.23% for the student housing + faculty staff SF<br />
Service Area Billing<br />
Academic 194 1,812 0.35 9.75% + faculty staff MF<br />
Single family<br />
2000 Units<br />
No. Buildings Accounts - Year 2000 3<br />
Data Sources / Notes<br />
2000 Data Category 2000 Data<br />
Data Sources / Notes<br />
Athletics 1 75,330 0.08 2.09% 1-detached 615 615 Gross Academic Square Footage 8,342,334 These numbers are<br />
Construction Project 1 50,220 0.05 1.39% 1-attached 319 319 Student Housing Beds 9,354 from Stanford University<br />
Comm Spaces 1 75,330 0.08 2.09% Subtotal 934 934 NA Housing Characteristics from U.S. Census Bureau Faculty/Staff Housing Units 882 <strong>Water</strong> Conservation, Reuse,<br />
Med School_Hospita 2 87,885 0.18 4.88% Multi family Medical School Occupants 4,082 and Recycling Master Plan<br />
CEF 1 552,420 0.55 15.32% 2-units 38 19 Total Population 19,666 October 2003 page 21<br />
Lake System 1 1,093,911 1.09 30.35% 3-4 units 279 80<br />
Total 228 3.60 100.00% 5 to 9 units 562 80<br />
Total <strong>Water</strong> Purchased (produced) 4 = 2.70 MGD From 5 year BAWUA Survey average 10-19 units 206 14<br />
Unaccounted For <strong>Water</strong> (UFW) 5 = 6.6% Percent 7% if actual is < 7%, otherwise = E25 20 or more units 1,242 25 Meter for assumed 50 units per building<br />
Estimated UFW for DSS Model = 7% Percent Add UFW to Total <strong>Water</strong> Use mobile homes 0 0 Meter for mobile<br />
<strong>Water</strong> Produced for use in DSS Model 3.86 MGD Subtotal 2,327 218 NA Must be more than one building on an MF meter.<br />
Peaking Factor 1.58 Provided by Agency or <strong>SFPUC</strong> <strong>Water</strong> Master Plan (or NA) MF Average = 10.7 units/building NA Units include all multi-family dwellings plus the "1-attached" dwellings.<br />
Peaking Factor for DSS Model= 1.58 If NA use default value of 1.6.<br />
Total SF + MF units = 3,261<br />
- Blue cells are entered by modeler Population and Household Size in Census 2000 and <strong>Water</strong> Conservation, Reuse, and Recycling Master Plan data for Stanford University<br />
- Yellow cells are input to DSS Model Estimated<br />
NOTES<br />
Residential<br />
1. - Communities served includes all or portions of) Stanford University according to BAWUA survey<br />
Stanford Stanford Service Area<br />
Census Population Estimated Population Population<br />
Data Sources / Notes<br />
2 - Average gpd/a is based on a 12-month moving average through December 2000. Indoor use is based on average of 2 lowest consecutive months in the winter<br />
if meters read bimonthly, or single lowest month if meters read monthly.<br />
3 - Number of accounts is from data provided by water agency for this project (see worksheet with account data in this file)<br />
4 - Total water Purchased (produced) taken from BAWUA for Fiscal Year 2001-2002 or agency if provided.<br />
5 - Unaccounted for <strong>Water</strong> (UFW) is the percent difference between the total water purchased and the total water use.<br />
6 - For reference see additional population estimates provided in population and employment estimates corresponding to service area table.<br />
7 - For reference see table below that has 2000 census data for corresponding water service area city or cities. For Stanford, acutal housing information in the<br />
DSS model was provided by Stanford Planning Department.<br />
2000 2000 2000 Estimated growth from 2000 to 2001 (CA DOF <strong>Projections</strong>): 0.00%<br />
Total Population from Census data 6 = 13,315 13315 Estimated employment growth from 2000 to 2001 (ABAG Employment <strong>Projections</strong>): 0.00%<br />
Subtract Institutionalized Population = 0 0 <strong>Water</strong> use for the institutionalized population is accounted for in nonresidential billing categories<br />
Residential Population = 13,315 13,315 Residential population shown corresponds to the city or cities represented by Census data<br />
Avg. HHS 7 = 4.08<br />
MF Pop @ MF HHS 7 = 2.13 4,957 4,957 4,957 37.2% Percent of Population that is MF<br />
SF Pop = 8,358 8,358 8,358 62.8% Percent of Population that is SF<br />
SF HHS 7 = 8.95<br />
Total 13,315 100.0%<br />
-11,385 Difference in our estimate and average of 2000-2001 and 2001-2002 BAWUA Surveys<br />
-11,385 Difference in our estimate and the average 2000-2001 and 2001-2002 BAWUA Surveys including institutionalized population<br />
^^Cansus data for Stanford is for reference only. Actual data used provided<br />
2000 Census Data by Stanford Planning Department, a campus population of 19,666 in year 2000 19,666<br />
Average household size 2.22 which is also used in the 2003 <strong>Water</strong> Conservation, Reuse and Recycling Master Plan 5,034 Difference in Stanford Planning Department estimates of daytime population and 2000-2001 BAWUA Surveys<br />
Average household size of owner-occupied unit 2.51<br />
Average household size of renter-occupied unit 2.13 Estimate Service Area Dwelling Units for 2001<br />
Homeowner vacancy rate (percent) 0.40 SF Res 934 Equals No. Buildings from cell M21 plus growth in accounts for one year from cell T38<br />
Rental vacancy rate (percent) 3.00 MF Res 64 Equals billing accounts in 2000 from cell C17 times average units per building in cell L30 to minimize population difference in cell N47<br />
Population and Employment Estimates Corresponding to Service Area<br />
Population<br />
Employment<br />
2000 Census data for jurisdiction 13,315 NA<br />
2000 ABAG (jurisdictional) NA NA<br />
2005 ABAG Projection (jurisdictional) NA NA<br />
Data Prepared : September 7, 2003<br />
2000 ABAG (subregional) NA NA<br />
Revised: March 2, 2004<br />
By: M. Maddaus 2005 ABAG Projection (subregional) NA NA<br />
2000 Department of Finance Benchmark NA From State of California Department of Finance (DOF) table E-4 as of 4-1-2000. Website www.dof.ca.gov<br />
2001 Department of Finance Estimate NA From State of California Department of Finance table E-4 as of 1-1-2001. Website www.dof.ca.gov<br />
2002 Department of Finance Estimate NA From State of California Department of Finance table E-4 as of 1-1-2002. Website www.dof.ca.gov<br />
FY 2000-2001 BAWUA service area 24,700 NA<br />
FY 2001-2002 BAWUA service area 24,700 NA<br />
2001 Employment in Service Area (input to DSS Model) = NA Service Area Employment is determined by the ratio of the 2000-2001 BAWUA service area population to the<br />
2000 ABAG Subregional Population and escalated to 2001 using the assumed growth rate in cell T39. (EXPLAIN SOURCE)<br />
Definitions / Abbreviations<br />
ABAG Association of Bay Area Governments MF multi family<br />
BAWUA Bay Area <strong>Water</strong> Users Association MGD million gallons per day<br />
DSS Decision Support System Model No. number<br />
du dwelling unit Pop population<br />
FY Fiscal Year Res residential<br />
gpd/a gallons per day / per account SF single family<br />
gpd gallons per day UFW unaccounted for water<br />
HHS<br />
household size


