

SFPUC Wholesale Customer Water Demand Projections ... - BAWSCA
SFPUC Wholesale Customer Water Demand Projections ... - BAWSCA
SFPUC Wholesale Customer Water Demand Projections ... - BAWSCA

Create successful ePaper yourself
Turn your PDF publications into a flip-book with our unique Google optimized e-Paper software.
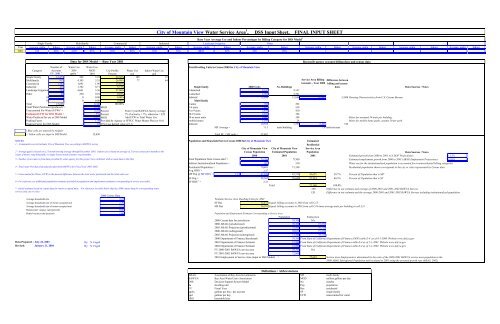
City of Mountain View <strong>Water</strong> Service Area 1 , DSS Input Sheet, FINAL INPUT SHEET<br />
Base Year Average Use and Indoor Percentages by Billing Category for DSS Model 2<br />
Single Family<br />
Multifamily<br />
Commercial<br />
Industrial<br />
Landscape Irrigation<br />
Other<br />
Year Average, gpd/a Indoor Average, gpd/a Indoor Average, gpd/a Indoor Average, gpd/a Indoor Average, gpd/a Indoor Average, gpd/a Indoor Average, gpd/a Indoor Average, gpd/a Indoor Average, gpd/a Indoor Average, gpd/a Indoor<br />
2001 242 66% 4105 83% 1691 86% 1702 74% 4641 22% 250 18%<br />
Data for DSS Model - - Base Year 2001<br />
Reconcile agency account billing data and census data<br />
Number of <strong>Water</strong> Use <strong>Water</strong> Use,<br />
Total Dwelling Units in Census 2000 for City of Mountain View<br />
Category Accounts 2001 MGD Use Profile <strong>Water</strong> Use Indoor <strong>Water</strong> Use<br />
FY. 2001 3 gpd/a 2 2001 Percent gcd gcd<br />
Single Family 12,473 242 3.01 24.30% 109 72<br />
Multifamily 815 4,105 3.35 26.98% 77 64<br />
Service Area Billing Difference between<br />
Commercial 1,162 1,691 1.96 15.85%<br />
Accounts - Year 2000 billing and census<br />
Industrial 416 1,702 0.71 5.71%<br />
Single family<br />
2000 Units<br />
No. Buildings<br />
3<br />
data<br />
Landscape Irrigation 723 4,641 3.36 27.06% 1-detached 9,147 9,147<br />
Other 49 250 0.01 0.10% 1-attached 3,701 3,701<br />
0 0 0.00 0.00% Subtotal 12,848 12,848 10,800 -2,048 Housing Characteristics from U.S. Census Bureau<br />
0 0 0.00 0.00% Multi family<br />
Total 15,638 12.40 100.00% 2-units 783 392<br />
Total <strong>Water</strong> Purchased (produced) 4 = 12.26 MGD 3-4 units 1,887 539<br />
Unaccounted For <strong>Water</strong> (UFW) 5 = 2.2% Percent From 5 year BAWUA Survey average 5 to 9 units 2,870 410<br />
Estimated UFW for DSS Model = 7% Percent 7% if actual is < 7%, otherwise = E25 10-19 units 2,916 194<br />
<strong>Water</strong> Produced for use in DSS Model 13.27 MGD Add UFW to Total <strong>Water</strong> Use 20 or more units 9,902 198<br />
Meter for assumed 50 units per building.<br />
Peaking Factor 1.50 Provided by Agency or <strong>SFPUC</strong> <strong>Water</strong> Master Plan (or NA) mobile homes 1,195 24<br />
Meter for mobile home parks, assume 50 per park.<br />
Peaking Factor for DSS Model= 1.5 If NA use default value of 1.6. Subtotal 19,553 1,757 2,493 736<br />
MF Average = 11.1 units/building 7.8 units/account<br />
- Blue cells are entered by modeler<br />
- Yellow cells are input to DSS Model 12,630 Total SF + MF units = 32,401<br />
Data Sources / Notes<br />
NOTES<br />
1. - Communities served includes City of Mountain View according to BAWUA survey<br />
Population and Household Size in Census 2000 forCity of Mountain View Estimated<br />
Residential<br />
City of Mountain View City of Mountain View Service Area<br />
Census Population Estimated Population Population<br />
2 - Average gpd/a is based on a 12-month moving average through December 2001. Indoor use is based on average of 2 lowest consecutive months in the<br />
winter if meters read bimonthly, or single lowest month if meters read monthly.<br />
3 - Number of accounts is from data provided by water agency for this project (see worksheet with account data in this file)<br />
4 - Total water Purchased (produced) taken from BAWUA for Fiscal Year 2001-2002.<br />
5 - Unaccounted for <strong>Water</strong> (UFW) is the percent difference between the total water purchased and the total water use.<br />
6 - For reference see additional population estimates provided in population and employment estimates corresponding to service area table.<br />
7 - Initial estimate based on census data for renter occupied units. For reference see table below that has 2000 census data for corresponding water<br />
service area city or cities.<br />
Data Sources / Notes<br />
2000 2001 2001 Estimated growth from 2000 to 2001 (CA DOF <strong>Projections</strong>): 1.12%<br />
Total Population from Census data 6 = 70,708 71500 Estimated employment growth from 2000 to 2001 (ABAG Employment <strong>Projections</strong>): 0.36%<br />
Subtract Institutionalized Population = 307 310 <strong>Water</strong> use for the institutionalized population is accounted for in nonresidential billing categories<br />
Residential Population = 70,401 71,190 Residential population shown corresponds to the city or cities represented by Census data<br />
Avg. HHS 7 = 2.17<br />
MF Pop @ MF HHS 7 = 2.15 42,039 42,510 43,625 59.7% Percent of Population that is MF<br />
SF Pop = 28,362 28,680 27,534 40.3% Percent of Population that is SF<br />
SF HHS 7 = 2.21<br />
Total 71,160 100.0%<br />
-190 Difference in our estimate and average of 2000-2001 and 2001-2002 BAWUA Surveys<br />
120 Difference in our estimate and the average 2000-2001 and 2001-2002 BAWUA Surveys including institutionalized population<br />
2000 Census Data<br />
Average household size 2.25 Estimate Service Area Dwelling Units for 2001<br />
Average household size of owner-occupied unit 2.30 SF Res 12,473 Equals billing accounts in 2001 from cell C15<br />
Average household size of renter-occupied unit 2.21 MF Res 20,291 Equals billing accounts in 2001 from cell C16 times average units per building in cell L31<br />
Homeowner vacancy rate (percent) 0.60<br />
Rental vacancy rate (percent) 1.60 Population and Employment Estimates Corresponding to Service Area<br />
Population<br />
Employment<br />
2000 Census data for jurisdiction 70,708 NA<br />
2000 ABAG (jurisdictional) 70,708 75,370<br />
2005 ABAG Projection (jurisdictional) 73,100 76,710<br />
2000 ABAG (subregional) 70,877 77,370<br />
2005 ABAG Projection (subregional) 73,300 78,710<br />
2000 Department of Finance Benchmark 70,708 From State of California Department of Finance (DOF) table E-4 as of 4-1-2000. Website www.dof.ca.gov<br />
Data Prepared : July 24, 2003 By: N. Foged 2001 Department of Finance Estimate 71,500 From State of California Department of Finance table E-4 as of 1-1-2001. Website www.dof.ca.gov<br />
Revised: January 21, 2004 By: N. Foged 2002 Department of Finance Estimate 71,500 From State of California Department of Finance table E-4 as of 1-1-2002. Website www.dof.ca.gov<br />
FY 2000-2001 BAWUA service area 70,700 NA<br />
FY 2001-2002 BAWUA service area 72,000<br />
2001 Employment in Service Area (input to DSS Model) = 75,629 Service Area Employment is determined by the ratio of the 2000-2001 BAWUA service area population to the<br />
2000 ABAG Subregional Population and escalated to 2001 using the assumed growth rate (ABAG, 2002)<br />
Definitions / Abbreviations<br />
ABAG Association of Bay Area Governments MF multi family<br />
BAWUA Bay Area <strong>Water</strong> Users Association MGD million gallons per day<br />
DSS Decision Support System Model No. number<br />
du dwelling unit Pop population<br />
FY Fiscal Year Res residential<br />
gpd/a gallons per day / per account SF single family<br />
gpd gallons per day UFW unaccounted for water<br />
HHS<br />
household size


