

SFPUC Wholesale Customer Water Demand Projections ... - BAWSCA
SFPUC Wholesale Customer Water Demand Projections ... - BAWSCA
SFPUC Wholesale Customer Water Demand Projections ... - BAWSCA

Create successful ePaper yourself
Turn your PDF publications into a flip-book with our unique Google optimized e-Paper software.
SECTIONTHREE<br />
Establishing Base - Year Conditions<br />
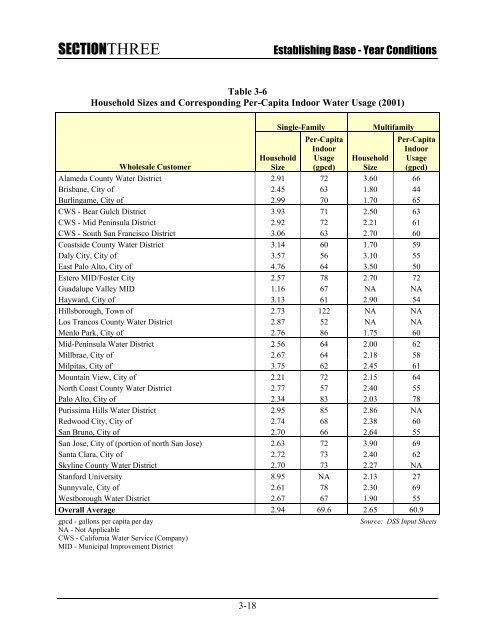
Table 3-6<br />
Household Sizes and Corresponding Per-Capita Indoor <strong>Water</strong> Usage (2001)<br />
Single-Family<br />
Per-Capita<br />
Indoor<br />
Usage<br />
(gpcd)<br />
Multifamily<br />
Per-Capita<br />
Indoor<br />
Usage<br />
(gpcd)<br />
<strong>Wholesale</strong> <strong>Customer</strong><br />
Household<br />
Size<br />
Household<br />
Size<br />
Alameda County <strong>Water</strong> District 2.91 72 3.60 66<br />
Brisbane, City of 2.45 63 1.80 44<br />
Burlingame, City of 2.99 70 1.70 65<br />
CWS - Bear Gulch District 3.93 71 2.50 63<br />
CWS - Mid Peninsula District 2.92 72 2.21 61<br />
CWS - South San Francisco District 3.06 63 2.70 60<br />
Coastside County <strong>Water</strong> District 3.14 60 1.70 59<br />
Daly City, City of 3.57 56 3.10 55<br />
East Palo Alto, City of 4.76 64 3.50 50<br />
Estero MID/Foster City 2.57 78 2.70 72<br />
Guadalupe Valley MID 1.16 67 NA NA<br />
Hayward, City of 3.13 61 2.90 54<br />
Hillsborough, Town of 2.73 122 NA NA<br />
Los Trancos County <strong>Water</strong> District 2.87 52 NA NA<br />
Menlo Park, City of 2.76 86 1.75 60<br />
Mid-Peninsula <strong>Water</strong> District 2.56 64 2.00 62<br />
Millbrae, City of 2.67 64 2.18 58<br />
Milpitas, City of 3.75 62 2.45 61<br />
Mountain View, City of 2.21 72 2.15 64<br />
North Coast County <strong>Water</strong> District 2.77 57 2.40 55<br />
Palo Alto, City of 2.34 83 2.03 78<br />
Purissima Hills <strong>Water</strong> District 2.95 85 2.86 NA<br />
Redwood City, City of 2.74 68 2.38 60<br />
San Bruno, City of 2.70 66 2.64 55<br />
San Jose, City of (portion of north San Jose) 2.63 72 3.90 69<br />
Santa Clara, City of 2.72 73 2.40 62<br />
Skyline County <strong>Water</strong> District 2.70 73 2.27 NA<br />
Stanford University 8.95 NA 2.13 27<br />
Sunnyvale, City of 2.61 78 2.30 69<br />
Westborough <strong>Water</strong> District 2.67 67 1.90 55<br />
Overall Average 2.94 69.6 2.65 60.9<br />
gpcd - gallons per capita per day<br />
NA - Not Applicable<br />
CWS - California <strong>Water</strong> Service (Company)<br />
MID - Municipal Improvement District<br />
Source: DSS Input Sheets<br />
3-18


