

SFPUC Wholesale Customer Water Demand Projections ... - BAWSCA
SFPUC Wholesale Customer Water Demand Projections ... - BAWSCA
SFPUC Wholesale Customer Water Demand Projections ... - BAWSCA

You also want an ePaper? Increase the reach of your titles
YUMPU automatically turns print PDFs into web optimized ePapers that Google loves.
Single family<br />
Multifamily<br />
Commercial<br />
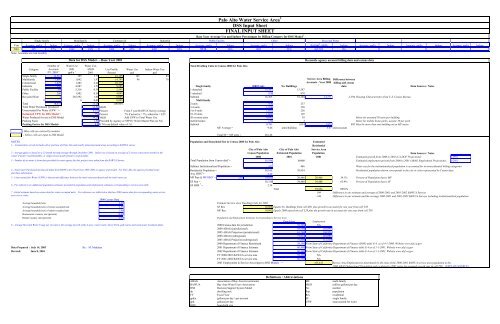
Base Year Average Use and Indoor Percentages by Billing Category for DSS Model 2<br />
Year Average, gpd/a Indoor Average, gpd/a Indoor Average, gpd/a Indoor Average, gpd/a Indoor Average, gpd/a Indoor Average, gpd/a Indoor Average 8 , gpd/a Indoor Average, gpd/a Indoor Average, gpd/a Indoor Average, gpd/a Indoor<br />
2001 395 57% 1042 81% 1482 63% 4987 65% 5316 34% 1902 23% 265,592 0%<br />
Note: Accounts are read monthly<br />
Data for DSS Model - - Base Year 2001<br />
Number of <strong>Water</strong> Use <strong>Water</strong> Use,<br />
Total Dwelling Units in Census 2000 for Palo Alto<br />
Category Accounts 2001 MGD Use Profile <strong>Water</strong> Use Indoor <strong>Water</strong> Use<br />
FY. 2001 3 gpd/a 2 2001 Percent gcd gcd<br />
Single family 14,515 395 5.73 43.12% 145 83<br />
Multifamily 1,886 1,042 1.97 14.79% 96 78<br />
Service Area Billing Difference between<br />
Commercial 1,629 1,482 2.41 18.17%<br />
Accounts - Year 2000 billing and census<br />
Industrial 247 4,987 1.23 9.28%<br />
Single family<br />
2000 Units<br />
No. Buildings<br />
3<br />
data<br />
Data Sources / Notes<br />
Public Facility 64 5,316 0.34 2.54% 1-detached 15,387 15,387<br />
Other 286 1,902 0.54 4.09% 1-attached 978 978<br />
Recycled <strong>Water</strong> 4 265,592 1.06 8.00% Subtotal 16,365 16,365 14,771 -1,594 Housing Characteristics from U.S. Census Bureau<br />
0 0 0.00 0.00% Multi family<br />
Total 18,631 13.28 100.00% 2-units 474 237<br />
Total <strong>Water</strong> Purchased (produced) 4 = 13.53 MGD 3-4 units 1,254 358<br />
Unaccounted For <strong>Water</strong> (UFW) 5 = 6.3% Percent From 5 year BAWUA Survey average 5 to 9 units 1,653 236<br />
Estimated UFW for DSS Model = 7% Percent 7% if actual is < 7%, otherwise = E25 10-19 units 1,602 107<br />
<strong>Water</strong> Produced for use in DSS Model 14.21 MGD Add UFW to Total <strong>Water</strong> Use 20 or more units 4,642 93<br />
Meter for assumed 50 units per building<br />
Peaking Factor 1.50 Provided by Agency or <strong>SFPUC</strong> <strong>Water</strong> Master Plan (or NA) mobile homes 156 3<br />
Meter for mobile home parks, assume 50 per park<br />
Peaking Factor for DSS Model= 1.5 If NA use default value of 1.6. Subtotal 9,781 1,034 1,929 895 Must be more than one building on an MF meter.<br />
MF Average = 9.46 units/building 5.07 units/account<br />
- Blue cells are entered by modeler<br />
- Yellow cells are input to DSS Model Total SF + MF units = 26,146<br />
NOTES<br />
1. - Communities served (includes all or portions of) Palo Alto and nearby unincorporated areas according to BAWUA survey<br />
Population and Household Size in Census 2000 for Palo Alto Estimated<br />
Residential<br />
City of Palo Alto City of Palo Alto Service Area<br />
Census Population Estimated Population Population<br />
2 - Average gpd/a is based on a 12-month moving average through December 2001. Indoor use is based on average of 2 lowest consecutive months in the<br />
winter if meters read bimonthly, or single lowest month if meters read monthly.<br />
3 - Number of accounts is from data provided by water agency for this project were taken from the BAWUA Survey.<br />
4 - Total water Purchased (produced) taken from BAWUA for Fiscal Year 2001-2002 or agency if provided. For Palo Alto, the agency provided water<br />
purchase information.<br />
5 - Unaccounted for <strong>Water</strong> (UFW) is the percent difference between the total water purchased and the total water use.<br />
6 - For reference see additional population estimates provided in population and employment estimates corresponding to service area table.<br />
7 - Initial estimate based on census data for renter occupied units. For reference see table below that has 2000 census data for corresponding water service<br />
area city or cities.<br />
Industrial<br />
Public Facility<br />
Palo Alto <strong>Water</strong> Service Area 1<br />
DSS Input Sheet<br />
FINAL INPUT SHEET<br />
Reconcile agency account billing data and census data<br />
Data Sources / Notes<br />
2000 2001 2001 Estimated growth from 2000 to 2001 (CA DOF <strong>Projections</strong>): 3.08%<br />
Total Population from Census data 6 = 58,598 60400 Estimated employment growth from 2000 to 2001 (ABAG Employment <strong>Projections</strong>): 0.20%<br />
Subtract Institutionalized Population = 433 446 <strong>Water</strong> use for the institutionalized population is accounted for in nonresidential billing categories<br />
Residential Population = 58,165 59,954 Residential population shown corresponds to the city or cities represented by Census data<br />
Avg. HHS 7 = 2.22<br />
MF Pop @ MF HHS 7 = 2.03 19,855 20,466 20,466 34.1% Percent of Population that is MF<br />
SF Pop = 38,310 39,488 39,488 65.9% Percent of Population that is SF<br />
SF HHS 7 = 2.34<br />
Total 59,954 100.0%<br />
104 Difference in our estimate and average of 2000-2001 and 2001-2002 BAWUA Surveys<br />
-343 Difference in our estimate and the average 2000-2001 and 2001-2002 BAWUA Surveys including institutionalized population<br />
2000 Census Data<br />
Average household size 2.30 Estimate Service Area Dwelling Units for 2001<br />
Average household size of owner-occupied unit 2.55 SF Res 16,868 Equals No. Buildings from cell M21 plus growth in accounts for one year from cell T38<br />
Average household size of renter-occupied unit 1.96 MF Res 10,082 Equals 2000 units from cell L29 plus the growth rate in accounts for one year from cell T38<br />
Homeowner vacancy rate (percent) 0.60<br />
Rental vacancy rate (percent) 2.00 Population and Employment Estimates Corresponding to Service Area<br />
Population<br />
Employment<br />
8 - Average Recycled <strong>Water</strong> Usage per Account is the average of each of the 4 uses: water trucks, Greer Park, golf course and wastewater treatment plant.<br />
2000 Census data for jurisdiction 58,598 NA<br />
2000 ABAG (jurisdictional) 58,598 103,890<br />
2005 ABAG Projection (jurisdictional) 61,200 104,920<br />
2000 ABAG (subregional) 71,914 110,890<br />
2005 ABAG Projection (subregional) 75,800 112,520<br />
2000 Department of Finance Benchmark 58,598 From State of California Department of Finance (DOF) table E-4 as of 4-1-2000. Website www.dof.ca.gov<br />
Data Prepared : July 14, 2003 By: M. Maddaus 2001 Department of Finance Estimate 60,400 From State of California Department of Finance table E-4 as of 1-1-2001. Website www.dof.ca.gov<br />
Revised: June 8, 2004 2002 Department of Finance Estimate 60,400 From State of California Department of Finance table E-4 as of 1-1-2002. Website www.dof.ca.gov<br />
FY 2000-2001 BAWUA service area 59,350 NA<br />
FY 2001-2002 BAWUA service area 60,350 NA<br />
2001 Employment in Service Area (input to DSS Model) = 105,432 Service Area Employment is determined by the ratio of the 2000-2001 BAWUA service area population to the<br />
2000 ABAG Subregional Population and escalated to 2001 using the assumed growth rate in cell T39. (EXPLAIN SOURCE)<br />
Other<br />
Recycled <strong>Water</strong><br />
Definitions / Abbreviations<br />
ABAG Association of Bay Area Governments MF multi family<br />
BAWUA Bay Area <strong>Water</strong> Users Association MGD million gallons per day<br />
DSS Decision Support System Model No. number<br />
du dwelling unit Pop population<br />
FY Fiscal Year Res residential<br />
gpd/a gallons per day / per account SF single family<br />
gpd gallons per day UFW unaccounted for water<br />
HHS<br />
household size


