

SFPUC Wholesale Customer Water Demand Projections ... - BAWSCA
SFPUC Wholesale Customer Water Demand Projections ... - BAWSCA
SFPUC Wholesale Customer Water Demand Projections ... - BAWSCA

You also want an ePaper? Increase the reach of your titles
YUMPU automatically turns print PDFs into web optimized ePapers that Google loves.
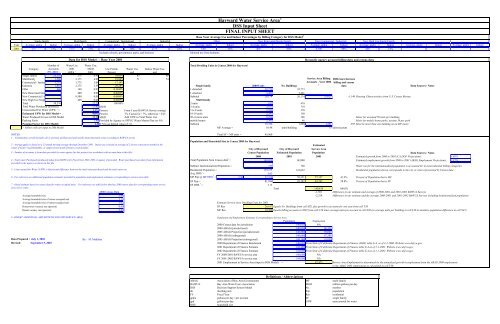
Base Year Average Use and Indoor Percentages by Billing Category for DSS Model 2<br />
Single family<br />
Multifamily<br />
Commercial / Institutional<br />
Industrial<br />
Other<br />
New Renovated Single Family<br />
New Commercial / Industrial<br />
New High Use Single Family<br />
Year Average, gpd/a Indoor Average, gpd/a Indoor Average, gpd/a Indoor Average, gpd/a Indoor Average, gpd/a Indoor Average, gpd/a Indoor Average, gpd/a Indoor Average, gpd/a Indoor Average, gpd/a Indoor Average, gpd/a Indoor<br />
2001 275 73% 3175 75% 1775 70% 2175 72% 140 56% 400 60% 8,500 80% 440 33%<br />
Includes schools, government, parks, and business<br />
Metered use from hydrants<br />
Data for DSS Model - - Base Year 2001<br />
Number of <strong>Water</strong> Use <strong>Water</strong> Use,<br />
Total Dwelling Units in Census 2000 for Hayward<br />
Category Accounts 2001 MGD Use Profile <strong>Water</strong> Use Indoor <strong>Water</strong> Use<br />
FY. 2001 3 gpd/a 2 2001 Percent gcd gcd<br />
Single family 25,135 275 6.91 39.03% 83 60<br />
Multifamily 1,286 3,175 4.08 23.06% 71 54<br />
Service Area Billing Difference between<br />
Commercial / Institut 1,715 1,775 3.04 17.19%<br />
Accounts - Year 2000 billing and census<br />
Industrial 1,651 2,175 3.59 20.28%<br />
Single family<br />
2000 Units<br />
No. Buildings<br />
3<br />
data<br />
Data Sources / Notes<br />
Other 486 140 0.07 0.3842% 1-detached 22,773 22,773<br />
New Renovated Sing 1 400 0.00 0.0023% 1-attached 3,401 3,401<br />
New Commercial / In 1 8,500 0.01 0.0480% Subtotal 26,174 26,174 25,025 -1,149 Housing Characteristics from U.S. Census Bureau<br />
New High Use Single 1 440 0.00 0.0025% Multi family<br />
Total 30,276 17.71 100.00% 2-units 835 418<br />
Total <strong>Water</strong> Purchased (produced) 4 = 17.92 MGD 3-4 units 2,517 719<br />
Unaccounted For <strong>Water</strong> (UFW) 5 = 9.0% Percent From 5 year BAWUA Survey average 5 to 9 units 2,590 370<br />
Estimated UFW for DSS Model = 9.0% Percent 7% if actual is < 7%, otherwise = E25 10-19 units 2,247 150<br />
<strong>Water</strong> Produced for use in DSS Model 19.30 MGD Add UFW to Total <strong>Water</strong> Use 20 or more units 9,296 186<br />
Meter for assumed 50 units per building<br />
Peaking Factor 1.80 Provided by Agency or <strong>SFPUC</strong> <strong>Water</strong> Master Plan (or NA) mobile homes 2,301 46<br />
Meter for mobile home parks, assume 50 per park<br />
Peaking Factor for DSS Model= 1.8 If NA use default value of 1.6. Subtotal 19,786 1,888 1,291 -597 Must be more than one building on an MF meter.<br />
- Yellow cells are input to DSS Model MF Average = 10.48 units/building 15 units/account<br />
NOTES Total SF + MF units = 45,960<br />
1. - Communities served (includes all or portions of) Hayward and nearby unincorporated areas according to BAWUA survey<br />
Population and Household Size in Census 2000 for Hayward<br />
2 - Average gpd/a is based on a 12-month moving average through December 2001. Indoor use is based on average of 2 lowest consecutive months in the<br />
winter if meters read bimonthly, or single lowest month if meters read monthly.<br />
3 - Number of accounts is from data provided by water agency for this project (see worksheet with account data in this file)<br />
4 - Total water Purchased (produced) taken from BAWUA for Fiscal Year 2001-2002 or agency if provided. <strong>Water</strong> purchased was taken from information<br />
provided by the agency as shown in this file.<br />
5 - Unaccounted for <strong>Water</strong> (UFW) is the percent difference between the total water purchased and the total water use.<br />
6 - For reference see additional population estimates provided in population and employment estimates corresponding to service area table.<br />
Hayward <strong>Water</strong> Service Area 1<br />
DSS Input Sheet<br />
FINAL INPUT SHEET<br />
Reconcile agency account billing data and census data<br />
Estimated<br />
City of Hayward City of Hayward Service Area<br />
Census Population Estimated Population Population<br />
Data Sources / Notes<br />
2000 2001 2001 Estimated growth from 2000 to 2001 (CA DOF <strong>Projections</strong>): 1.69%<br />
Total Population from Census data 6 = 140,030 142400 Estimated employment growth from 2000 to 2001 (ABAG Employment <strong>Projections</strong>): 1.32%<br />
Subtract Institutionalized Population = 755 768 <strong>Water</strong> use for the institutionalized population is accounted for in nonresidential billing categories<br />
Residential Population = 139,275 141,632 Residential population shown corresponds to the city or cities represented by Census data<br />
Avg. HHS 7 = 3.03<br />
MF Pop @ MF HHS 7 = 2.90 57,379 58,351 57,157 41.2% Percent of Population that is MF<br />
SF Pop = 81,896 83,282 83,282 58.8% Percent of Population that is SF<br />
7 - Initial estimate based on census data for renter occupied units. For reference see table below that has 2000 census data for corresponding water service<br />
SF HHS 7 = 3.13<br />
area city or cities.<br />
Total 140,439 100.0%<br />
2000 Census Data -1,561 Difference in our estimate and average of 2000-2001 and 2001-2002 BAWUA Surveys<br />
Average household size 3.08 -2,329 Difference in our estimate and the average 2000-2001 and 2001-2002 BAWUA Surveys including institutionalized population<br />
Average household size of owner-occupied unit 3.13<br />
Average household size of renter-occupied unit 3.02 Estimate Service Area Dwelling Units for 2001<br />
Homeowner vacancy rate (percent) 0.60 SF Res 26,617 Equals No. Buildings from cell M21 plus growth in accounts for one year from cell T38<br />
Rental vacancy rate (percent) 2.60 MF Res 19,709 Equals billing accounts in 2001 from cell C16 times average units per account in cell N30 (or average units per building in cell L30 to minimize population difference in cell N47)<br />
8 -(INSERT ADDITIONAL ASSUMPTIONS FOR THIS SERVICE AREA)<br />
Population and Employment Estimates Corresponding to Service Area<br />
Population<br />
Employment<br />
2000 Census data for jurisdiction 140,030 NA<br />
2000 ABAG (jurisdictional) 140,030 86,350<br />
2005 ABAG Projection (jurisdictional) 148,880 92,060<br />
2000 ABAG (subregional) 140,660 87,380<br />
Data Prepared : July 1, 2003 By: M. Maddaus 2005 ABAG Projection (subregional) 148,100 91,050<br />
Revised: September 5, 2003 2000 Department of Finance Benchmark 140,030 From State of California Department of Finance (DOF) table E-4 as of 4-1-2000. Website www.dof.ca.gov<br />
2001 Department of Finance Estimate 142,400 From State of California Department of Finance table E-4 as of 1-1-2001. Website www.dof.ca.gov<br />
2002 Department of Finance Estimate 144,000 From State of California Department of Finance table E-4 as of 1-1-2002. Website www.dof.ca.gov<br />
FY 2000-2001 BAWUA service area 140,000 NA<br />
FY 2001-2002 BAWUA service area 144,000 NA<br />
2001 Employment in Service Area (input to DSS Model) = 87,473 Service Area Employment is determined by the annualized growth in employment from the ABAG 2000 employment<br />
to the ABAG 2005 employment as calculated in cell T39.<br />
Definitions / Abbreviations<br />
ABAG Association of Bay Area Governments MF multi family<br />
BAWUA Bay Area <strong>Water</strong> Users Association MGD million gallons per day<br />
DSS Decision Support System Model No. number<br />
du dwelling unit Pop population<br />
FY Fiscal Year Res residential<br />
gpd/a gallons per day / per account SF single family<br />
gpd gallons per day UFW unaccounted for water<br />
HHS<br />
household size


