

SFPUC Wholesale Customer Water Demand Projections ... - BAWSCA
SFPUC Wholesale Customer Water Demand Projections ... - BAWSCA
SFPUC Wholesale Customer Water Demand Projections ... - BAWSCA

Create successful ePaper yourself
Turn your PDF publications into a flip-book with our unique Google optimized e-Paper software.
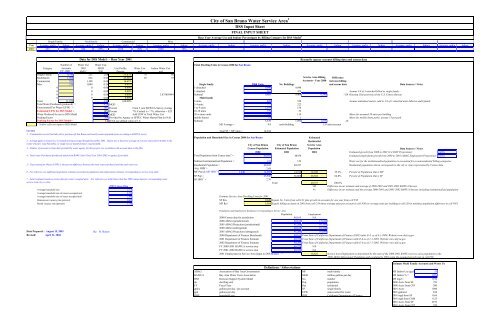
City of San Bruno <strong>Water</strong> Service Area 1<br />
DSS Input Sheet<br />
FINAL INPUT SHEET<br />
Base Year Average Use and Indoor Percentages by Billing Category for DSS Model 2<br />
Single Family<br />
Multifamily<br />
Commercial<br />
Misc<br />
Year Average, gpd/a Indoor Average, gpd/a Indoor Average, gpd/a Indoor Average, gpd/a Indoor Average, gpd/a Indoor Average, gpd/a Indoor Average, gpd/a Indoor Average, gpd/a Indoor Average, gpd/a Indoor Average, gpd/a Indoor<br />
2001 223 84% 834 85% 1100 76% 1000 18%<br />
Data for DSS Model - - Base Year 2001<br />
Number of <strong>Water</strong> Use <strong>Water</strong> Use,<br />
Total Dwelling Units in Census 2000 for San Bruno<br />
Category Accounts 2001 MGD Use Profile <strong>Water</strong> Use Indoor <strong>Water</strong> Use<br />
FY. 2001 3 gpd/a 2 2001 Percent gcd gcd<br />
Single Family 9,340 223 2.08 53.67% 78 66<br />
Multifamily 1,098 834 0.92 23.64% 65 55<br />
Service Area Billing<br />
Commercial 585 1,100 0.64 16.61%<br />
Accounts - Year 2000<br />
Misc 236 1,000 0.24 6.09%<br />
Single family<br />
2000 Units<br />
No. Buildings<br />
3<br />
0 0 0.00 0.00% 1-detached 9,040 9,040<br />
0 0 0.00 0.00% 1-attached 565 424<br />
0 0 0.00 0.00% 3.875895949 Subtotal 9,605 9,464 9,340 -124<br />
0 0 0.00 0.00% Multi family<br />
Total 11,259 3.88 100.00% 2-units 409 550<br />
Total <strong>Water</strong> Purchased (produced) 4 = 4.28 MGD 3-4 units 777 222<br />
Unaccounted For <strong>Water</strong> (UFW) 5 = 14% Percent From 5 year BAWUA Survey average 5 to 9 units 1,079 154<br />
Estimated UFW for DSS Model = 14% Percent 7% if actual is < 7%, otherwise = E25 10-19 units 779 52<br />
<strong>Water</strong> Produced for use in DSS Model 4.43 MGD Add UFW to Total <strong>Water</strong> Use 20 or more units 2,280 114<br />
Peaking Factor NA Provided by Agency or <strong>SFPUC</strong> <strong>Water</strong> Master Plan (or NA) mobile homes 15 1<br />
Peaking Factor for DSS Model= 1.6 If NA use default value of 1.6. Subtotal 5,339 1,093 1,075 -18<br />
- Yellow cells are input to DSS Model MF Average = 4.9 units/building 5.0 units/account<br />
NOTES Total SF + MF units = 14,944<br />
1. - Communities served (includes all or portions of) San Bruno and nearby unincorporated areas according to BAWUA survey<br />
Population and Household Size in Census 2000 for San Bruno<br />
2 - Average gpd/a is based on a 12-month moving average through December 2001. Indoor use is based on average of 2 lowest consecutive months in the<br />
winter if meters read bimonthly, or single lowest month if meters read monthly.<br />
3 - Number of accounts is from data provided by water agency for this project (see worksheet with account data in this file)<br />
4 - Total water Purchased (produced) taken from BAWUA for Fiscal Year 2001-2002 or agency if provided.<br />
5 - Unaccounted for <strong>Water</strong> (UFW) is the percent difference between the total water purchased and the total water use.<br />
6 - For reference see additional population estimates provided in population and employment estimates corresponding to service area table.<br />
Estimated<br />
Residential<br />
City of San Bruno City of San Bruno Service Area<br />
Census Population Estimated Population Population<br />
Reconcile agency account billing data and census data<br />
Assume 3/4 of 1-attached billed as single family<br />
Housing Characteristics from U.S. Census Bureau<br />
Data Sources / Notes<br />
Data Sources / Notes<br />
2000 2001 2001 Estimated growth from 2000 to 2001 (CA DOF <strong>Projections</strong>): 0.46%<br />
Total Population from Census data 6 = 40,165 40350 Estimated employment growth from 2000 to 2001 (ABAG Employment <strong>Projections</strong>): 0.44%<br />
Subtract Institutionalized Population = 122 123 <strong>Water</strong> use for the institutionalized population is accounted for in nonresidential billing categories<br />
Residential Population = 40,043 40,227 Residential population shown corresponds to the city or cities represented by Census data<br />
Avg. HHS 7 = 2.68<br />
MF Pop @ MF HHS 7 = 2.64 14,095 14,160 14,160 35.2% Percent of Population that is MF<br />
SF Pop = 25,948 26,068 26,568 64.8% Percent of Population that is SF<br />
7 - Initial estimate based on census data for renter occupied units. For reference see table below that has 2000 census data for corresponding water<br />
SF HHS 7 = 2.70<br />
service area city or cities.<br />
Total 40,727 100.0%<br />
2000 Census Data 163 Difference in our estimate and average of 2000-2001 and 2001-2002 BAWUA Surveys<br />
Average household size 2.72 41 Difference in our estimate and the average 2000-2001 and 2001-2002 BAWUA Surveys including institutionalized population<br />
Average household size of owner-occupied unit 2.76<br />
Average household size of renter-occupied unit 2.66 Estimate Service Area Dwelling Units for 2001<br />
Homeowner vacancy rate (percent) 0.40 SF Res 9,649 Equals No. Units from cell L21 plus growth in accounts for one year from cell T38<br />
Rental vacancy rate (percent) 1.70 MF Res 5,364 Equals billing accounts in 2001 from cell C16 times average units per account in cell N30 (or average units per building in cell L30 to minimize population difference in cell N47)<br />
Difference<br />
between billing<br />
and census data<br />
Assume individual meters, add in 1/4 of 1-attached units billed as multi family<br />
Meter for assumed 20 units per building<br />
Meter for mobile home parks, assume 15 per park<br />
Population and Employment Estimates Corresponding to Service Area<br />
Population<br />
Employment<br />
2000 Census data for jurisdiction 40,165 NA<br />
2000 ABAG (jurisdictional) 40,165 15,810<br />
2005 ABAG Projection (jurisdictional) 41,200 16,160<br />
2000 ABAG (subregional) 40,165 16,330<br />
Data Prepared : August 15, 2003 By: B. Skeens 2005 ABAG Projection (subregional) 41,200 16,680<br />
Revised: April 21, 2004 2000 Department of Finance Benchmark 40,165 From State of California Department of Finance (DOF) table E-4 as of 4-1-2000. Website www.dof.ca.gov<br />
2001 Department of Finance Estimate 40,350 From State of California Department of Finance table E-4 as of 1-1-2001. Website www.dof.ca.gov<br />
2002 Department of Finance Estimate 40,200 From State of California Department of Finance table E-4 as of 1-1-2002. Website www.dof.ca.gov<br />
FY 2000-2001 BAWUA service area 40,778 NA<br />
FY 2001-2002 BAWUA service area 40,350 NA<br />
2001 Employment in Service Area (input to DSS Model) = 16,622 Service Area Employment is determined by the ratio of the 2000-2001 BAWUA service area population to the<br />
2000 ABAG Subregional Population and escalated to 2001 using the assumed growth rate in cell T39.<br />
Estimate Multi Family Accounts and <strong>Water</strong> Use<br />
Definitions / Abbreviations<br />
ABAG Association of Bay Area Governments MF multi family MF Indoor Use (gcd) 55<br />
BAWUA Bay Area <strong>Water</strong> Users Association MGD million gallons per day MF Indoor % = 85%<br />
DSS Decision Support System Model No. number MF mgd = 0.92<br />
du dwelling unit Pop population 2000 Accts from SF 793<br />
FY Fiscal Year Res residential 2000 Accts from COM 300<br />
gpd/a gallons per day / per account SF single family 2001 Accts 1098<br />
gpd gallons per day UFW unaccounted for water 2001 gpd/acct 834<br />
HHS household size DOF California Department of Finance 2001 mgd from SF 0.66<br />
2001 mgd from COM 0.25<br />
2001 Accts from SF 2972<br />
2001 Accts from COM 228


