

SFPUC Wholesale Customer Water Demand Projections ... - BAWSCA
SFPUC Wholesale Customer Water Demand Projections ... - BAWSCA
SFPUC Wholesale Customer Water Demand Projections ... - BAWSCA

Create successful ePaper yourself
Turn your PDF publications into a flip-book with our unique Google optimized e-Paper software.
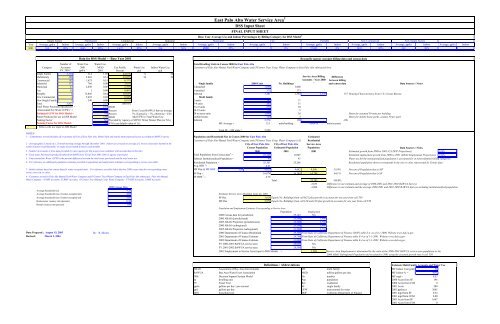
East Palo Alto <strong>Water</strong> Service Area 1<br />
DSS Input Sheet<br />
FINAL INPUT SHEET<br />
Base Year Average Use and Indoor Percentages by Billing Category for DSS Model 2<br />
Single Family<br />
Multifamily<br />
Commercial<br />
Industrial<br />
Municipal<br />
Fire<br />
Portable<br />
New Commercial<br />
New Single Family<br />
Year Average, gpd/a Indoor Average, gpd/a Indoor Average, gpd/a Indoor Average, gpd/a Indoor Average, gpd/a Indoor Average, gpd/a Indoor Average, gpd/a Indoor Average, gpd/a Indoor Average, gpd/a Indoor Average, gpd/a Indoor<br />
2001 314 90% 2665 90% 1,675 85% 766 56% 2030 25% 1 0% 72,805 0% 5493 85% 340 90%<br />
Data for DSS Model - - Base Year 2001<br />
Number of <strong>Water</strong> Use <strong>Water</strong> Use,<br />
Total Dwelling Units in Census 2000 for East Palo Alto<br />
Category Accounts 2001 MGD Use Profile <strong>Water</strong> Use Indoor <strong>Water</strong> Use <strong>Customer</strong>s of Palo Alto Mutual Park <strong>Water</strong> Company and O'Connor Tract Coop. <strong>Water</strong> Company in East Palo Alto subtracted here.<br />
FY. 2001 3 gpd/a 2 2001 Percent gcd gcd<br />
Single Family 3,338 314 1.05 44.87% 71 64<br />
Multifamily 200 2,665 0.53 22.85% 56 50<br />
Service Area Billing Difference<br />
Commercial 102 1,675 0.15 6.37%<br />
Accounts - Year 2000 between billing<br />
Industrial 117 766 0.09 3.83%<br />
Single family<br />
2000 Units<br />
No. Buildings<br />
3<br />
and census data<br />
Data Sources / Notes<br />
Municipal 27 2,030 0.05 2.32% 1-detached 3,008 3,008<br />
Fire 30 1 0.00 0.00% 1-attached 373 373<br />
Portable 6 72,805 0.44 18.83% Subtotal 3,381 3,381 3,538 157 Housing Characteristics from U.S. Census Bureau<br />
New Commercial 4 5,493 0.02 0.94% Multi family<br />
New Single Family 1 340 0.00 0.01% 2-units 145 71<br />
Total 3,823 2.33 100.01% 3-4 units 205 51<br />
Total <strong>Water</strong> Purchased (produced) 4 = 2.33 MGD 5 to 9 units 272 39<br />
Unaccounted For <strong>Water</strong> (UFW) 5 = 6% Percent From 5 year BAWUA Survey average 10-19 units -74 -5<br />
Estimated UFW for DSS Model = 7% Percent 7% if actual is < 7%, otherwise = E25 20 or more units 1,890 38<br />
Meter for assumed 50 units per building<br />
<strong>Water</strong> Produced for use in DSS Model 2.50 MGD Add UFW to Total <strong>Water</strong> Use mobile homes 140 3<br />
Meter for mobile home parks, assume 50 per park<br />
Peaking Factor NA Provided by Agency or <strong>SFPUC</strong> <strong>Water</strong> Master Plan (or NA) Subtotal 2,578 196 -196<br />
Peaking Factor for DSS Model= 1.6 If NA use default value of 1.6. MF Average = 13.1 units/building #DIV/0! units/account<br />
- Yellow cells are input to DSS Model<br />
Total SF + MF units = 5,959<br />
NOTES<br />
1. - Communities served (includes all or portions of) City of East Palo Alto, Menlo Park and nearby unincorporated areas according to BAWUA survey<br />
Population and Household Size in Census 2000 for East Palo Alto<br />
Estimated<br />
<strong>Customer</strong>s of Palo Alto Mutual Park <strong>Water</strong> Company and O'Connor Tract Coop. <strong>Water</strong> Company in Ea Residential<br />
2 - Average gpd/a is based on a 12-month moving average through December 2001. Indoor use is based on average of 2 lowest consecutive months in the<br />
City of East Palo Alto City of East Palo Alto Service Area<br />
winter if meters read bimonthly, or single lowest month if meters read monthly.<br />
Census Population Estimated Population Population<br />
Data Sources / Notes<br />
3 - Number of accounts is from data provided by water agency for this project (see worksheet with account data in this file)<br />
2000 2001 2001 Estimated growth from 2000 to 2001 (CA DOF <strong>Projections</strong>): 0.66%<br />
4 - Total water Purchased (produced) taken from BAWUA for Fiscal Year 2001-2002 or agency if provided.<br />
Total Population from Census data 6 = 25,142 25307 Estimated employment growth from 2000 to 2001 (ABAG Employment <strong>Projections</strong>): 1.94%<br />
5 - Unaccounted for <strong>Water</strong> (UFW) is the percent difference between the total water purchased and the total water use.<br />
Subtract Institutionalized Population = 41 41 <strong>Water</strong> use for the institutionalized population is accounted for in nonresidential billing categories<br />
6 - For reference see additional population estimates provided in population and employment estimates corresponding to service area table.<br />
7 - Initial estimate based on census data for renter occupied units. For reference see table below that has 2000 census data for corresponding water<br />
service area city or cities.<br />
Reconcile agency account billing data and census data<br />
Residential Population = 25,101 25,266 Residential population shown corresponds to the city or cities represented by Census data<br />
Avg. HHS 7 = 4.21<br />
MF Pop @ MF HHS 7 = 3.50 9,023 9,082 9,596 35.9% Percent of Population that is MF<br />
SF Pop = 16,078 16,184 14,798 64.1% Percent of Population that is SF<br />
8 - <strong>Customer</strong>s served by Palo Alto Mutual Park <strong>Water</strong> Company and O'Connor Tract <strong>Water</strong> Company in East Palo Alto subtracted. Palo Alto Mutual<br />
SF HHS 7 = 4.76<br />
<strong>Water</strong> Company - 16 RSF Accounts, 32 RMF Accounts. O'Connor Tract Mutual Coop. <strong>Water</strong> Company - 578 RSF Accounts, 2 RMF Accounts.<br />
Total 24,395 100.0%<br />
-3,855 Difference in our estimate and average of 2000-2001 and 2001-2002 BAWUA Surveys<br />
2000 Census Data -3,896 Difference in our estimate and the average 2000-2001 and 2001-2002 BAWUA Surveys including institutionalized population<br />
Average household size 4.20<br />
Average household size of owner-occupied unit 4.69 Estimate Service Area Dwelling Units for 2001<br />
Average household size of renter-occupied unit 3.83 SF Res 3,028 Equals No. Buildings from cell M21 plus growth in accounts for one year from cell T38<br />
Homeowner vacancy rate (percent) 0.30 MF Res 2,970 Equals No. Buildings from cell L20 and L29 plus growth in accounts for one year from cell T38<br />
Rental vacancy rate (percent) 1.00<br />
Population and Employment Estimates Corresponding to Service Area<br />
Population<br />
Employment<br />
2000 Census data for jurisdiction 25,142 NA<br />
2000 ABAG (jurisdictional) 29,506 3,400<br />
2005 ABAG Projection (jurisdictional) 34,500 3,730<br />
2000 ABAG (subregional) 29,506 3,400<br />
2005 ABAG Projection (subregional) 31,500 3,730<br />
Data Prepared : August 15, 2003 By: B. Skeens 2000 Department of Finance Benchmark 29,506 From State of California Department of Finance (DOF) table E-4 as of 4-1-2000. Website www.dof.ca.gov<br />
Revised: March 2, 2004 2001 Department of Finance Estimate 29,700 From State of California Department of Finance table E-4 as of 1-1-2001. Website www.dof.ca.gov<br />
2002 Department of Finance Estimate 31,000 From State of California Department of Finance table E-4 as of 1-1-2002. Website www.dof.ca.gov<br />
FY 2000-2001 BAWUA service area 28,000 NA<br />
FY 2001-2002 BAWUA service area 28,500 NA<br />
2001 Employment in Service Area (input to DSS Model) = 3,289 Service Area Employment is determined by the ratio of the 2000-2001 BAWUA service area population to the<br />
2000 ABAG Subregional Population and escalated to 2001 using the assumed growth rate in cell T39.<br />
Definitions / Abbreviations<br />
Estimate Multi Family Accounts and <strong>Water</strong> Use<br />
ABAG Association of Bay Area Governments MF multi family MF Indoor Use (gcd)= 50<br />
BAWUA Bay Area <strong>Water</strong> Users Association MGD million gallons per day MF Indoor % = 90%<br />
DSS Decision Support System Model No. number MF mgd = 0.53<br />
du dwelling unit Pop population 2000 Accts from SF 196<br />
FY Fiscal Year Res residential 2000 Accts from COM 0<br />
gpd/a gallons per day / per account SF single family 2001 Accts 200<br />
gpd gallons per day UFW unaccounted for water 2001 gpd/acct 2665<br />
HHS household size DOF California Department of Finance 2001 mgd from SF 0.52<br />
2001 mgd from COM 0.00<br />
2001 Accts from SF 1667<br />
2001 Accts from COM 0


