Bangladesh Country Investment Plan - Feed the Future
Bangladesh Country Investment Plan - Feed the Future
Bangladesh Country Investment Plan - Feed the Future

You also want an ePaper? Increase the reach of your titles
YUMPU automatically turns print PDFs into web optimized ePapers that Google loves.
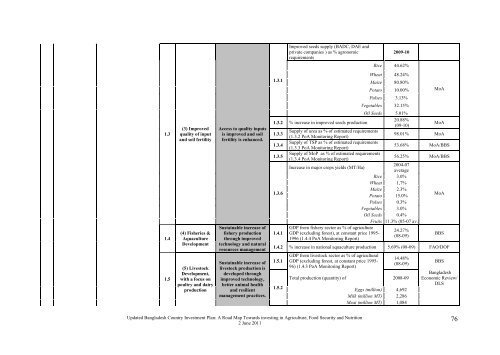
Improved seeds supply (BADC, DAE and<br />
private companies ) as % agronomic<br />
requirements<br />
2009-10<br />
Rice 44.62%<br />
1.3<br />
1.4<br />
1.5<br />
(3) Improved<br />
quality of input<br />
and soil fertility<br />
(4) Fisheries &<br />
Aquaculture<br />
Development<br />
(5) Livestock<br />
Development,<br />
with a focus on<br />
poultry and dairy<br />
production<br />
Access to quality inputs<br />
is improved and soil<br />
fertility is enhanced.<br />
Sustainable increase of<br />
fishery production<br />
through improved<br />
technology and natural<br />
resources management<br />
Sustainable increase of<br />
livestock production is<br />
developed through<br />
improved technology,<br />
better animal health<br />
and resilient<br />
management practices.<br />
1.3.1<br />
Wheat 48.24%<br />
Maize 80.80%<br />
Potato 10.00%<br />
Pulses 3.13%<br />
Vegetables 32.15%<br />
MoA<br />
Oil Seeds 5.01%<br />
1.3.2 % increase in improved seeds production<br />
20.88%<br />
(09-10)<br />
MoA<br />
1.3.3<br />
Supply of urea as % of estimated requirements<br />
(1.3.2 PoA Monitoring Report)<br />
98.01% MoA<br />
1.3.4<br />
Supply of TSP as % of estimated requirements<br />
(1.3.3 PoA Monitoring Report)<br />
53.68% MoA/BBS<br />
1.3.5<br />
Supply of MoP as % of estimated requirements<br />
(1.3.4 PoA Monitoring Report)<br />
56.25% MoA/BBS<br />
Increase in major crops yields (MT/Ha)<br />
2004-07<br />
average<br />
Rice 3.0%<br />
Wheat 1,7%<br />
1.3.6<br />
Maize 2.3%<br />
Potato 15.0%<br />
MoA<br />
Pulses 0.3%<br />
Vegetables 3.0%<br />
Oil Seeds 0.4%<br />
Fruits 11.3% (05-07 av.)<br />
1.4.1<br />
GDP from fishery sector as % of agriculture<br />
24.27%<br />
GDP (excluding forest), at constant price 1995-<br />
(08-09)<br />
1996 (1.4.4 PoA Monitoring Report)<br />
BBS<br />
1.4.2 % increase in national aquaculture production 5.69% (08-09) FAO/DOF<br />
1.5.1<br />
1.5.2<br />
GDP from livestock sector as % of agricultural<br />
GDP (excluding forest, at constant price 1995-<br />
96) (1.4.3 PoA Monitoring Report)<br />
14.48%<br />
(08-09)<br />
Total production (quantity) of 2008-09<br />
Eggs (million) 4,692<br />
Milk (million MT) 2,286<br />
Meat (million MT) 1,084<br />
BBS<br />
<strong>Bangladesh</strong><br />
Economic Review/<br />
DLS<br />
Updated <strong>Bangladesh</strong> <strong>Country</strong> <strong>Investment</strong> <strong>Plan</strong>: A Road Map Towards investing in Agriculture, Food Security and Nutrition<br />
2 June 2011<br />
76