
You also want an ePaper? Increase the reach of your titles
YUMPU automatically turns print PDFs into web optimized ePapers that Google loves.
100 ANNUAL<br />
GROUP CONSOLIDATED FINANCIAL STATEMENTS<br />
<strong>Capgemini</strong><br />
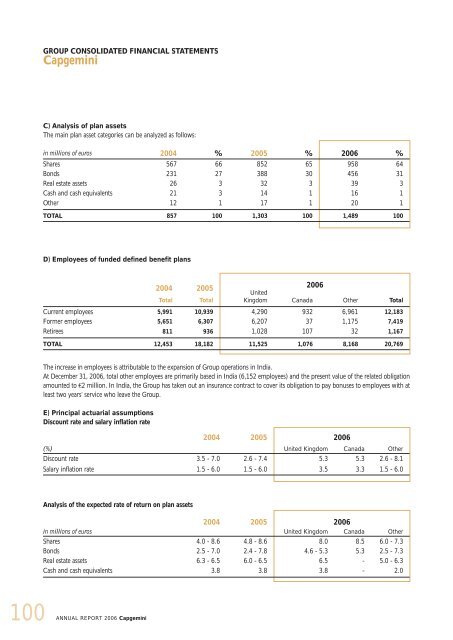
C) Analysis of plan assets<br />
The main plan asset categories can be analyzed as follows:<br />
in millions of euros 2004 % 2005 % 2006 %<br />
Shares 567 66 852 65 958 64<br />
Bonds 231 27 388 30 456 31<br />
Real estate assets 26 3 32 3 39 3<br />
Cash and cash equivalents 21 3 14 1 16 1<br />
Other 12 1 17 1 20 1<br />
TOTAL 857 100 1,303 100 1,489 100<br />
D) Employees of funded defined benefit plans<br />
REPORT 2006 <strong>Capgemini</strong><br />
2004<br />
Total<br />
2005<br />
Total<br />
2006<br />
United<br />
Kingdom Canada Other Total<br />
Current employees 5,991 10,939 4,290 932 6,961 12,183<br />
Former employees 5,651 6,307 6,207 37 1,175 7,419<br />
Retirees 811 936 1,028 107 32 1,167<br />
TOTAL 12,453 18,182 11,525 1,076 8,168 20,769<br />
The increase in employees is attributable to the expansion of Group operations in India.<br />
At December 31, 2006, total other employees are primarily based in India (6,152 employees) and the present value of the related obligation<br />
amounted to €2 million. In India, the Group has taken out an insurance contract to cover its obligation to pay bonuses to employees with at<br />
least two years’ service who leave the Group.<br />
E) Principal actuarial assumptions<br />
Discount rate and salary inflation rate<br />
2004 2005 2006<br />
(%) United Kingdom Canada Other<br />
Discount rate 3.5 - 7.0 2.6 - 7.4 5.3 5.3 2.6 - 8.1<br />
Salary inflation rate 1.5 - 6.0 1.5 - 6.0 3.5 3.3 1.5 - 6.0<br />
Analysis of the expected rate of return on plan assets<br />
2004 2005 2006<br />
in millions of euros United Kingdom Canada Other<br />
Shares 4.0 - 8.6 4.8 - 8.6 8.0 8.5 6.0 - 7.3<br />
Bonds 2.5 - 7.0 2.4 - 7.8 4.6 - 5.3 5.3 2.5 - 7.3<br />
Real estate assets 6.3 - 6.5 6.0 - 6.5 6.5 - 5.0 - 6.3<br />
Cash and cash equivalents 3.8 3.8 3.8 - 2.0