
You also want an ePaper? Increase the reach of your titles
YUMPU automatically turns print PDFs into web optimized ePapers that Google loves.
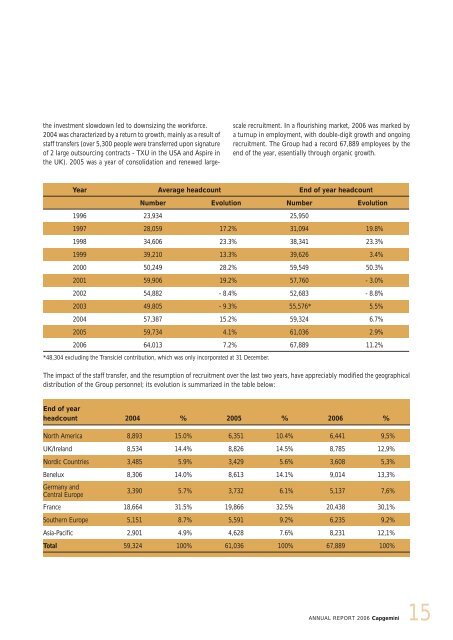
the investment slowdown led to downsizing the workforce.<br />
2004 was characterized by a return to growth, mainly as a result of<br />
staff transfers (over 5,300 people were transferred upon signature<br />
of 2 large outsourcing contracts - TXU in the USA and Aspire in<br />
the UK). 2005 was a year of consolidation and renewed large-<br />
scale recruitment. In a flourishing market, 2006 was marked by<br />
a turnup in employment, with double-digit growth and ongoing<br />
recruitment. The Group had a record 67,889 employees by the<br />
end of the year, essentially through organic growth.<br />
Year Average headcount End of year headcount<br />
Number Evolution Number Evolution<br />
1996 23,934 25,950<br />
1997 28,059 17.2% 31,094 19.8%<br />
1998 34,606 23.3% 38,341 23.3%<br />
1999 39,210 13.3% 39,626 3.4%<br />
2000 50,249 28.2% 59,549 50.3%<br />
2001 59,906 19.2% 57,760 - 3.0%<br />
2002 54,882 - 8.4% 52,683 - 8.8%<br />
2003 49,805 - 9.3% 55,576* 5.5%<br />
2004 57,387 15.2% 59,324 6.7%<br />
2005 59,734 4.1% 61,036 2.9%<br />
2006 64,013 7.2% 67,889 11.2%<br />
*48,304 excluding the Transiciel contribution, which was only incorporated at 31 December.<br />
The impact of the staff transfer, and the resumption of recruitment over the last two years, have appreciably modified the geographical<br />
distribution of the Group personnel; its evolution is summarized in the table below:<br />
End of year<br />
headcount 2004 % 2005 % 2006 %<br />
North America 8,893 15.0% 6,351 10.4% 6,441 9,5%<br />
UK/Ireland 8,534 14.4% 8,826 14.5% 8,785 12,9%<br />
Nordic Countries 3,485 5.9% 3,429 5.6% 3,608 5,3%<br />
Benelux 8,306 14.0% 8,613 14.1% 9,014 13,3%<br />
Germany and<br />
Central Europe<br />
3,390 5.7% 3,732 6.1% 5,137 7,6%<br />
France 18,664 31.5% 19,866 32.5% 20,438 30,1%<br />
Southern Europe 5,151 8.7% 5,591 9.2% 6,235 9,2%<br />
Asia-Pacific 2,901 4.9% 4,628 7.6% 8,231 12,1%<br />
Total 59,324 100% 61,036 100% 67,889 100%<br />
ANNUAL REPORT 2006 <strong>Capgemini</strong><br />
15