
You also want an ePaper? Increase the reach of your titles
YUMPU automatically turns print PDFs into web optimized ePapers that Google loves.
108 ANNUAL<br />
GROUP CONSOLIDATED FINANCIAL STATEMENTS<br />
<strong>Capgemini</strong><br />
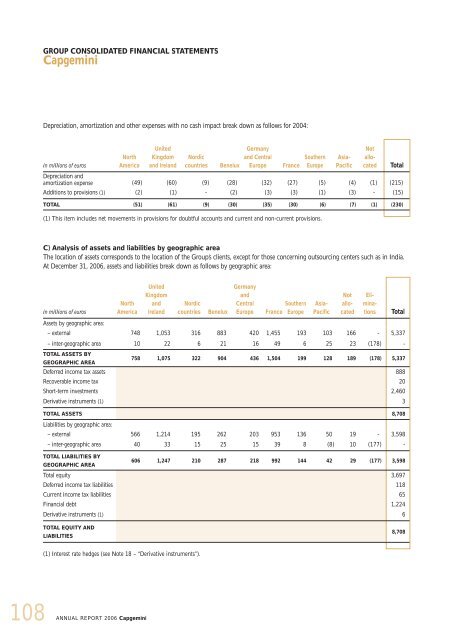
Depreciation, amortization and other expenses with no cash impact break down as follows for 2004:<br />
in millions of euros<br />
North<br />
America<br />
REPORT 2006 <strong>Capgemini</strong><br />
United<br />
Kingdom<br />
and Ireland<br />
Nordic<br />
countries Benelux<br />
Germany<br />
and Central<br />
Europe France<br />
Southern<br />
Europe<br />
Asia-<br />
Pacific<br />
Not<br />
allocated<br />
Total<br />
Depreciation and<br />
amortization expense (49) (60) (9) (28) (32) (27) (5) (4) (1) (215)<br />
Additions to provisions (1) (2) (1) - (2) (3) (3) (1) (3) - (15)<br />
TOTAL (51) (61) (9) (30) (35) (30) (6) (7) (1) (230)<br />
(1) This item includes net movements in provisions for doubtful accounts and current and non-current provisions.<br />
C) Analysis of assets and liabilities by geographic area<br />
The location of assets corresponds to the location of the Group’s clients, except for those concerning outsourcing centers such as in India.<br />
At December 31, 2006, assets and liabilities break down as follows by geographic area:<br />
in millions of euros<br />
North<br />
America<br />
United<br />
Kingdom<br />
and<br />
Ireland<br />
Nordic<br />
countries Benelux<br />
Germany<br />
and<br />
Central<br />
Southern<br />
Europe France Europe<br />
Asia-<br />
Pacific<br />
Not<br />
allocated<br />
Eliminations<br />
Total<br />
Assets by geographic area:<br />
– external 748 1,053 316 883 420 1,455 193 103 166 - 5,337<br />
– inter-geographic area 10 22 6 21 16 49 6 25 23 (178) -<br />
TOTAL ASSETS BY<br />
GEOGRAPHIC AREA<br />
758 1,075 322 904 436 1,504 199 128 189 (178) 5,337<br />
Deferred income tax assets 888<br />
Recoverable income tax 20<br />
Short-term investments 2,460<br />
Derivative instruments (1) 3<br />
TOTAL ASSETS<br />
Liabilities by geographic area:<br />
8,708<br />
– external 566 1,214 195 262 203 953 136 50 19 - 3,598<br />
– inter-geographic area 40 33 15 25 15 39 8 (8) 10 (177) -<br />
TOTAL LIABILITIES BY<br />
GEOGRAPHIC AREA<br />
606 1,247 210 287 218 992 144 42 29 (177) 3,598<br />
Total equity 3,697<br />
Deferred income tax liabilities 118<br />
Current income tax liabilities 65<br />
Financial debt 1,224<br />
Derivative instruments (1) 6<br />
TOTAL EQUITY AND<br />
LIABILITIES<br />
(1) Interest rate hedges (see Note 18 – “Derivative instruments”).<br />
8,708