
You also want an ePaper? Increase the reach of your titles
YUMPU automatically turns print PDFs into web optimized ePapers that Google loves.
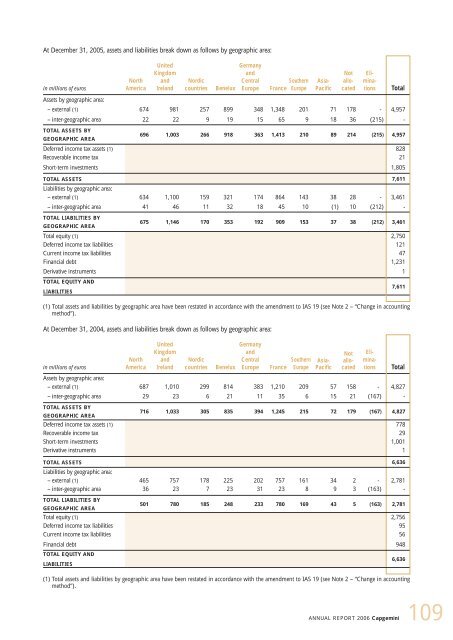
At December 31, 2005, assets and liabilities break down as follows by geographic area:<br />
in millions of euros<br />
North<br />
America<br />
United<br />
Kingdom<br />
and<br />
Ireland<br />
Nordic<br />
countries Benelux<br />
Germany<br />
and<br />
Central<br />
Southern<br />
Europe France Europe<br />
Asia-<br />
Pacific<br />
Not<br />
allocated<br />
Eliminations<br />
Total<br />
Assets by geographic area:<br />
– external (1) 674 981 257 899 348 1,348 201 71 178 - 4,957<br />
– inter-geographic area 22 22 9 19 15 65 9 18 36 (215) -<br />
TOTAL ASSETS BY<br />
GEOGRAPHIC AREA<br />
696 1,003 266 918 363 1,413 210 89 214 (215) 4,957<br />
Deferred income tax assets (1) 828<br />
Recoverable income tax 21<br />
Short-term investments 1,805<br />
TOTAL ASSETS<br />
Liabilities by geographic area:<br />
7,611<br />
– external (1) 634 1,100 159 321 174 864 143 38 28 - 3,461<br />
– inter-geographic area 41 46 11 32 18 45 10 (1) 10 (212) -<br />
TOTAL LIABILITIES BY<br />
GEOGRAPHIC AREA<br />
675 1,146 170 353 192 909 153 37 38 (212) 3,461<br />
Total equity (1) 2,750<br />
Deferred income tax liabilities 121<br />
Current income tax liabilities 47<br />
Financial debt 1,231<br />
Derivative instruments 1<br />
TOTAL EQUITY AND<br />
LIABILITIES<br />
7,611<br />
(1) Total assets and liabilities by geographic area have been restated in accordance with the amendment to IAS 19 (see Note 2 – “Change in accounting<br />
method”).<br />
At December 31, 2004, assets and liabilities break down as follows by geographic area:<br />
in millions of euros<br />
North<br />
America<br />
United<br />
Kingdom<br />
and<br />
Ireland<br />
Nordic<br />
countries Benelux<br />
Germany<br />
and<br />
Central<br />
Europe France<br />
Southern<br />
Europe<br />
Asia-<br />
Pacific<br />
Not<br />
allocated<br />
Eliminations<br />
Total<br />
Assets by geographic area:<br />
– external (1) 687 1,010 299 814 383 1,210 209 57 158 - 4,827<br />
– inter-geographic area 29 23 6 21 11 35 6 15 21 (167) -<br />
TOTAL ASSETS BY<br />
GEOGRAPHIC AREA<br />
716 1,033 305 835 394 1,245 215 72 179 (167) 4,827<br />
Deferred income tax assets (1) 778<br />
Recoverable income tax 29<br />
Short-term investments 1,001<br />
Derivative instruments 1<br />
TOTAL ASSETS<br />
Liabilities by geographic area:<br />
6,636<br />
– external (1) 465 757 178 225 202 757 161 34 2 - 2,781<br />
– inter-geographic area 36 23 7 23 31 23 8 9 3 (163) -<br />
TOTAL LIABILITIES BY<br />
GEOGRAPHIC AREA<br />
501 780 185 248 233 780 169 43 5 (163) 2,781<br />
Total equity (1) 2,756<br />
Deferred income tax liabilities 95<br />
Current income tax liabilities 56<br />
Financial debt 948<br />
TOTAL EQUITY AND<br />
LIABILITIES<br />
6,636<br />
(1) Total assets and liabilities by geographic area have been restated in accordance with the amendment to IAS 19 (see Note 2 – “Change in accounting<br />
method”).<br />
ANNUAL REPORT 2006 <strong>Capgemini</strong><br />
109