
Create successful ePaper yourself
Turn your PDF publications into a flip-book with our unique Google optimized e-Paper software.
16 ANNUAL<br />
THE GROUP<br />
<strong>Capgemini</strong><br />
The above evolution reflects the following:<br />
The continuing adaptation of our production capacity to the<br />
Rightshore TM model, combining local resources (in the client’s<br />
area) with those situated in specialized production centers, the<br />
balance depending on the technology or offer concerned. This<br />
explains, in particular, the development of our headcount in<br />
the Asia-Pacific region - where 12% of Group resources are<br />
concentrated - and in Central Europe;<br />
The continuing development of the local professional services<br />
activity, with strong representation in France and in Benelux,<br />
and a growth trend in North America;<br />
The maintaining of a local production workforce in all our<br />
geographic zones.<br />
In 2006, recruitment was stepped up and 18,600 new employees<br />
came onboard, compared with 14,500 in 2005. This same trend<br />
was prevalent in all countries and in all areas, a trend which was<br />
particularly marked in India where the headcount rose by 77%<br />
REPORT 2006 <strong>Capgemini</strong><br />
and the total number of new recruits was higher than the total<br />
headcount at the beginning of the year. Sogeti and OS recorded<br />
high recruitment rates - 4,300 and 3,700 respectively. To support<br />
our 2006 priority on recruitment for growth, a new global<br />
recruitment campaign was launched. This campaign received the<br />
2006 Award for the best global press recruitment campaign.<br />
Staff turnover (i.e. percentage of voluntary departures) slightly<br />
increased - reaching 16.6% in 2006 (compared with 15.4% in<br />
2005 and 14.1% in 2004) i.e. almost 10,700 voluntary departures<br />
during the year - which reflects the standard phenomenon i.e.<br />
increased mobility in Consulting and Services when the market is<br />
flourishing. This rate is carefully monitored in order to maintain<br />
it at the customary level for the sector, which is achieved through<br />
specific action or programs (implemented in function of the disciplines<br />
and geographic areas involved). Turnover rates in India,<br />
which has had a booming IT market for several years now, stand at<br />
approximately 20% instead of the 30% recorded two years ago.<br />
The utilization rate of resources - which measures the share of hours (excluding legal holidays or leave) worked by productive<br />
salaried staff and directly allocated to invoiceable services - is globally progressing compared to 2005 in the case of Projects and<br />
Consulting. Breakdown is as follows:<br />
Quarterly utilization 2005 2006<br />
rate Q1 Q2 Q3 Q4 Q1 Q2 Q3 Q4<br />
Consulting Services 62 67 66 66 66 69 66 69<br />
Technology Services 78 79 79 79 79 80 80 80<br />
Local Professional Services 85 86 86 86 85 85 86 86<br />
It should be noted that utilization rates are not monitored for outsourcing business, for which the indicator does not reflect the performance<br />
evolution.<br />
Since 2003, the Group measures and monitors the evolution of<br />
the indicators designed to provide pointers on the breakdown<br />
of its headcount. Average seniority, average age and male/female<br />
breakdown are recorded under these indicators.<br />
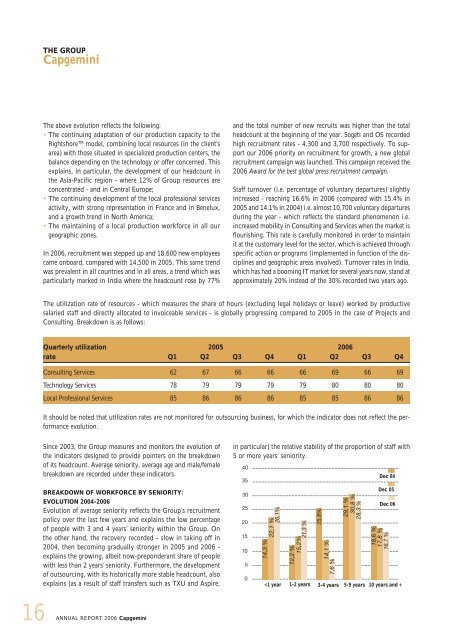
BREAKDOWN OF WORKFORCE BY SENIORITY:<br />
EVOLUTION 2004-2006<br />
Evolution of average seniority reflects the Group’s recruitment<br />
policy over the last few years and explains the low percentage<br />
of people with 3 and 4 years’ seniority within the Group. On<br />
the other hand, the recovery recorded - slow in taking off in<br />
2004, then becoming gradually stronger in 2005 and 2006 -<br />
explains the growing, albeit now-preponderant share of people<br />
with less than 2 years’ seniority. Furthermore, the development<br />
of outsourcing, with its historically more stable headcount, also<br />
explains (as a result of staff transfers such as TXU and Aspire,<br />
in particular) the relative stability of the proportion of staff with<br />
5 or more years’ seniority.<br />
40<br />
35<br />
30<br />
25<br />
20<br />
15<br />
10<br />
5<br />
0<br />
14,3 %<br />
22,1 %<br />
26,1%<br />
12,2 %<br />
15,2%<br />
21,3 %<br />
25,8%<br />
14,1 %<br />
7,6 %<br />
29,1 %<br />
30,8 %<br />
28,3 %<br />
Dec 04<br />
Dec 05<br />
Dec 06<br />
18,6 %<br />
17,8 %<br />
16,7 %<br />