
Create successful ePaper yourself
Turn your PDF publications into a flip-book with our unique Google optimized e-Paper software.
106 ANNUAL<br />
GROUP CONSOLIDATED FINANCIAL STATEMENTS<br />
<strong>Capgemini</strong><br />
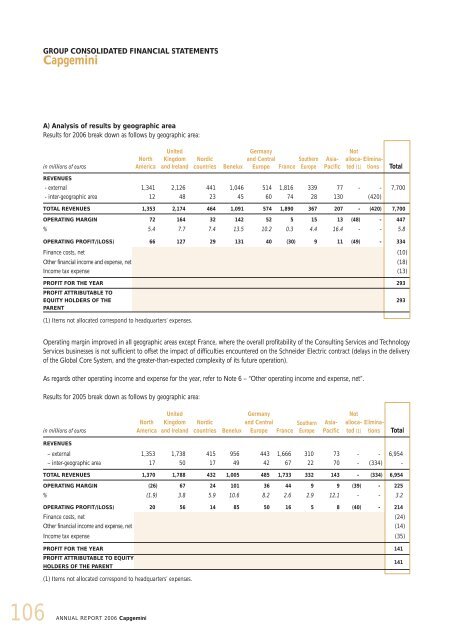
A) Analysis of results by geographic area<br />
Results for 2006 break down as follows by geographic area:<br />
in millions of euros<br />
North<br />
America<br />
REPORT 2006 <strong>Capgemini</strong><br />
United<br />
Kingdom<br />
and Ireland<br />
Nordic<br />
countries Benelux<br />
Germany<br />
and Central<br />
Southern<br />
Europe France Europe<br />
Asia-<br />
Pacific<br />
Not<br />
allocated<br />
(1)<br />
Eliminations<br />
Total<br />
REVENUES<br />
- external 1,341 2,126 441 1,046 514 1,816 339 77 - - 7,700<br />
- inter-geographic area 12 48 23 45 60 74 28 130 (420)<br />
TOTAL REVENUES 1,353 2,174 464 1,091 574 1,890 367 207 - (420) 7,700<br />
OPERATING MARGIN 72 164 32 142 52 5 15 13 (48) - 447<br />
% 5.4 7.7 7.4 13.5 10.2 0.3 4.4 16.4 - - 5.8<br />
OPERATING PROFIT/(LOSS) 66 127 29 131 40 (30) 9 11 (49) - 334<br />
Finance costs, net (10)<br />
Other financial income and expense, net (18)<br />
Income tax expense (13)<br />
PROFIT FOR THE YEAR 293<br />
PROFIT ATTRIBUTABLE TO<br />
EQUITY HOLDERS OF THE<br />
293<br />
PARENT<br />
(1) Items not allocated correspond to headquarters’ expenses.<br />
Operating margin improved in all geographic areas except France, where the overall profitability of the Consulting Services and Technology<br />
Services businesses is not sufficient to offset the impact of difficulties encountered on the Schneider Electric contract (delays in the delivery<br />
of the Global Core System, and the greater-than-expected complexity of its future operation).<br />
As regards other operating income and expense for the year, refer to Note 6 – “Other operating income and expense, net”.<br />
Results for 2005 break down as follows by geographic area:<br />
in millions of euros<br />
North<br />
America<br />
United<br />
Kingdom<br />
and Ireland<br />
Nordic<br />
Germany<br />
and Central<br />
countries Benelux Europe France<br />
Southern<br />
Europe<br />
Asia-<br />
Pacific<br />
Not<br />
allocaEliminated (1) tions Total<br />
REVENUES<br />
– external 1,353 1,738 415 956 443 1,666 310 73 - - 6,954<br />
– inter-geographic area 17 50 17 49 42 67 22 70 - (334) -<br />
TOTAL REVENUES 1,370 1,788 432 1,005 485 1,733 332 143 - (334) 6,954<br />
OPERATING MARGIN (26) 67 24 101 36 44 9 9 (39) - 225<br />
% (1.9) 3.8 5.9 10.6 8.2 2.6 2.9 12.1 - - 3.2<br />
OPERATING PROFIT/(LOSS) 20 56 14 85 50 16 5 8 (40) - 214<br />
Finance costs, net (24)<br />
Other financial income and expense, net (14)<br />
Income tax expense (35)<br />
PROFIT FOR THE YEAR 141<br />
PROFIT ATTRIBUTABLE TO EQUITY<br />
HOLDERS OF THE PARENT<br />
141<br />
(1) Items not allocated correspond to headquarters’ expenses.