
You also want an ePaper? Increase the reach of your titles
YUMPU automatically turns print PDFs into web optimized ePapers that Google loves.
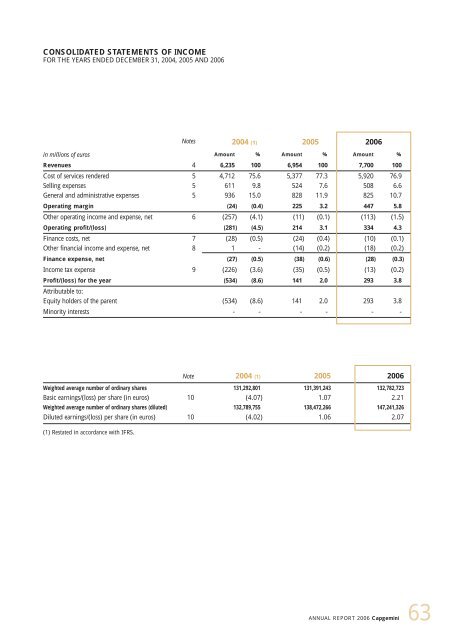
CONSOLIDATED STATEMENTS OF INCOME<br />
FOR THE YEARS ENDED DECEMBER 31, 2004, 2005 AND 2006<br />
in millions of euros<br />
Notes 2004 (1) 2005 2006<br />
Amount % Amount % Amount %<br />
Revenues 4 6,235 100 6,954 100 7,700 100<br />
Cost of services rendered 5 4,712 75.6 5,377 77.3 5,920 76.9<br />
Selling expenses 5 611 9.8 524 7.6 508 6.6<br />
General and administrative expenses 5 936 15.0 828 11.9 825 10.7<br />
Operating margin (24) (0.4) 225 3.2 447 5.8<br />
Other operating income and expense, net 6 (257) (4.1) (11) (0.1) (113) (1.5)<br />
Operating profit/(loss) (281) (4.5) 214 3.1 334 4.3<br />
Finance costs, net 7 (28) (0.5) (24) (0.4) (10) (0.1)<br />
Other financial income and expense, net 8 1 - (14) (0.2) (18) (0.2)<br />
Finance expense, net (27) (0.5) (38) (0.6) (28) (0.3)<br />
Income tax expense 9 (226) (3.6) (35) (0.5) (13) (0.2)<br />
Profit/(loss) for the year (534) (8.6) 141 2.0 293 3.8<br />
Attributable to:<br />
Equity holders of the parent (534) (8.6) 141 2.0 293 3.8<br />
Minority interests - - - - - -<br />
Note 2004 (1) 2005 2006<br />
Weighted average number of ordinary shares 131,292,801 131,391,243 132,782,723<br />
Basic earnings/(loss) per share (in euros) 10 (4.07) 1.07 2.21<br />
Weighted average number of ordinary shares (diluted) 132,789,755 138,472,266 147,241,326<br />
Diluted earnings/(loss) per share (in euros) 10 (4.02) 1.06 2.07<br />
(1) Restated in accordance with IFRS.<br />
ANNUAL REPORT 2006 <strong>Capgemini</strong><br />
63