Early on 30 January, a tropical low formed in theCoral Sea region and intensified into TC Ellie, aCat- 1 storm, on 1 February. TC Ellie reached peakwinds of 43 kt and made landfall in Australia on 2February. Torrential rain from the dying end of thisstorm flooded parts of Northern Queensland andcaused damages estimated at $110 million (AUS). TCInnes was the third to form in the southwest Pacificand initiated on 13 February as a tropical depressioneast of Fiji. On 17 February, after passing overVanuatu and moving toward New Caledonia, Inneswas upgraded to a TC. No significant impacts or lossof life were reported from this system. Subsequently,on ex-tropical transition, the dying remains of TCInnes merged with a low pressure system to the eastof Australia that generated significant rainfall innorthern New Zealand.Four TCs affected the southwest Pacific regionduring March. TC Hamish formed off the Australiancoast in the Coral Sea on 5 March. TC Joni followedon 11 March, and formed near the Southern CookIslands and attained a maximum intensity of 55 kt.Damage in the Southern Cooks from TC Joni wasminimal. TC Ken then formed between Niue andthe Southern Cook Islands on 17 March, attained amaximum intensity of 50 kt, and did not affect landareas. TC Jasper entered the southwest Pacific fromthe Coral Sea on 24 March with storm intensity andlater passed through New Caledonia’s waters, withno significant damage reported. Only one TC (Lin)formed in the basin during April. TC Lin formed on4 April east of Fiji and passed over Tongatapu on 5April. Sustained winds for Lin were estimated at 55kt with gusts up to 80 kt closer to the storm’s center.7) Australian Region basin—B. C. TrewinThe 2008/09 TC season was near normal in thebroader Australian basin (areas south of the Equatorand between 90°E and 160°E 12 , which includes Australian,Papua New Guinea, and Indonesian areas ofresponsibility). The season produced 10 TCs, equalto the long-term average. There were four TCs inthe eastern sector 13 of the Australian region during2008/09, five TCs in the western sector (one of which12 The Australian Bureau of Meteorology’s warning area overlapsboth the southern Indian Ocean and Southwest Pacific.13The western sector covers areas between 90°E and 125°E.The eastern sector covers areas east of the eastern Australiancoast to 160°E, as well as the eastern half of the Gulf ofCarpentaria. The northern sector covers areas from 125°Eto the western half of the Gulf of Carpentaria.formed in the northern sector before moving west),and one in the northern sector. There were four landfallsduring the season.The most intense TC of the season was Hamish,which tracked south-east, parallel to the Queenslandcoast, from 5 to 11 March. It reached its maximumintensity on 7 March while near 19°S, 150°E (approximately200 km offshore from Bowen), with estimatedmaximum gusts of 160 kt, maximum sustained windsof 115 kt, and a minimum central pressure of 925hPa, making it the most intense cyclone observed 14in the vicinity of the Queensland coast since 1918.It remained at Cat- 4 or 5 intensity 15 for three days.While Hamish posed a substantial potential threatto the Queensland coast, it did not make landfallor approach the coast closely enough to cause anysignificant damage on land. However, two lives werelost at sea, and damage to a ship from the associatedlarge waves resulted in a serious oil slick and coastalpollution in the Brisbane area.Four TCs made landfall during the season, thestrongest being Cat- 2. None caused significantdamage through wind or storm surge, but all wereassociated with flooding. Billy made landfall nearWyndham, Western Australia on 20 December asa Cat- 2 system, causing minor tree damage andwidespread flooding through the Kimberley region.The system later reintensified as it moved back overthe ocean and ultimately peaked at Cat- 4 intensity(maximum gusts 135 kt, maximum sustained winds95 kt, minimum central pressure 950 hPa) on 24December, when north of Port Hedland and movingaway from the coast.Two short-lived Cat- 1 systems affected Queenslandearly in <strong>2009</strong>. Charlotte made landfall near the GilbertRiver Mouth, on the east coast of the Gulf ofCarpentaria, on 12 January, while Ellie made landfallnorth of Cardwell, on the east coast, on 1 February.Both moved over areas that were already experiencingflooding and hence exacerbated conditions.The Herbert River catchment was severely affected,particularly around Ingham, which received 1481mm of rain from 25 January to 9 February, including949 mm from 30 January to 4 February. The heaviestdaily total associated with the system was 497 mm atHawkins Creek, northwest of Ingham.14Note that it is likely that the intensity of many cycloneswas underestimated prior to the use of satellite data fromthe 1970s.15 See http://www.bom.gov.au/weather/cyclone/faq/index.shtml for a definition of Australian TC categories.S98 | juNE 2010
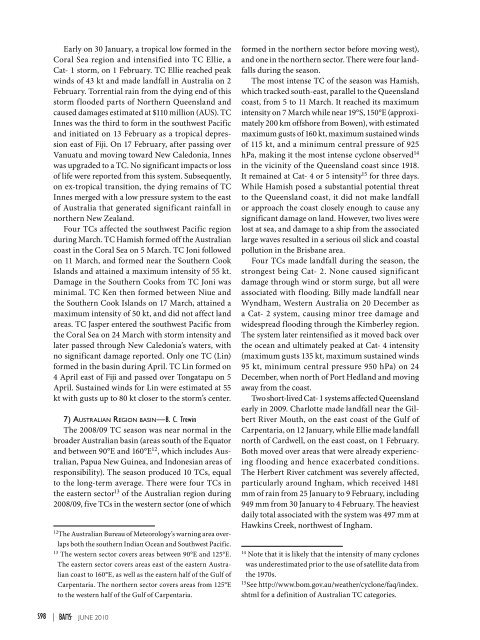
Fig. 4.26. Global anomalies of TCHP correspondingto <strong>2009</strong> computed as described in the text. The boxesindicate the seven regions where TCs occur: fromleft to right, Southwest Indian, North Indian, WestPacific, Southeast Indian, South Pacific, East Pacific,and North Atlantic (shown as Gulf of Mexico and tropicalAtlantic separately). The green lines indicate thetrajectories of all tropical cyclones reaching at leastCat- 1 (1-minute average maximum wind ≥119 km hr -1 )and above during November 2008–December <strong>2009</strong> inthe Southern Hemisphere and <strong>2009</strong> in the NorthernHemisphere. The numbers above each box correspondto the number of Cat- 1 and above cyclones that travelwithin each box. The Gulf of Mexico conditions duringJune–November <strong>2009</strong> are shown in detail in the insertshown in the lower right corner.The fourth landfalling system of the season wasDominic, a Cat- 2 system (maximum gusts 75 kt,maximum sustained winds 55 kt, minimum centralpressure 976 hPa) which made landfall near Onslow,Western Australia on 27 January. As for theQueensland systems, the principal impact was flooding,with daily rainfall totals of 243 mm at ThevenardIsland and 238 mm at Onslow Airport. Of those TCsthat did not make landfall, the most intense was Ilsa,which peaked at Cat- 3 intensity (maximum gusts125 kt, maximum sustained winds 90 kt, minimumcentral pressure 958 hPa) on 19 March when morethan 1000 km off the Western Australiancoast, near 16°S, 107°E.2008, <strong>2009</strong>), provided that atmospheric conditions arealso favorable. The TCHP shows high spatial and temporalvariability associated with oceanic mesoscalefeatures that can be globally detected with satellitealtimetry TCHP (Goni et al. <strong>2009</strong>). In general, thereal-time forecast of TC intensity is highly dependenton track forecasts and many of the errors introducedin the track forecast are translated into the intensityforecast (Mainelli, et al. 2008). Clearly, areas withhigh values of TCHP may be important only whenTCs travel over them.To examine the interannual variability of TCHPwith respect to TCs, TCHP anomalies are computedduring the months of TC activity in each hemisphere:June through November <strong>2009</strong> in the Northern Hemisphereand from November 2008 through April <strong>2009</strong>in the Southern Hemisphere. Anomalies are definedas departures from the mean TCHP calculated duringthe same months for the period 1993 to <strong>2009</strong>. Theseanomalies show large variability within and amongthe TC basins (Fig. 4.26).The WNP basin exhibits the anomalies from theEl Niño conditions, which have been in place in theequatorial Pacific Ocean since June <strong>2009</strong>. Similar tothe conditions during 2008, the South Pacific basinshowed mostly positive anomalies. The NIO basinexhibited positive values in the Bay of Bengal andin the Arabian Sea. The Gulf of Mexico (Figs. 4.26,4.27) showed mostly positive values except for asmall region of negative values, which was probablydue to a different location of the Loop Current. Thetropical Atlantic exhibited mostly positive values,which is also observed in sea height and SST fields(http://www.aoml.noaa.gov/phod/regsatprod/atln/index.php).The ENP season was very active although thefirst named storm of the season did not developuntil late in June, being the latest start of the ENPe. TC heat potential (TCHP)—G. J. Goni, J. A.Knaff, and I-I LinTCHP is discussed here for the seven TCbasins previously documented as a way tosummarize that activity from a slightly differentperspective. The TCHP, defined hereas the ocean heat content contained betweenthe sea surface and the depth of the 26°Cisotherm, has been shown to be more closelylinked than SST to intensity changes (Shay etal. 2000; Goni and Trinanes, 2003; Lin et al.,Fig. 4.27. Differences between the TCHP fields in <strong>2009</strong> and 2008.<strong>STATE</strong> <strong>OF</strong> <strong>THE</strong> <strong>CLIMATE</strong> <strong>IN</strong> <strong>2009</strong> juNE 2010 |S99
- Page 8 and 9:
Luo, Jing-Jia, Research Institute f
- Page 10 and 11:
Tedesco, Marco, Department Earth an
- Page 12 and 13:
4. THE TROPICS.....................
- Page 14 and 15:
ABSTRACT—M. O. Baringer, D. S. Ar
- Page 16 and 17:
I. INTRODUCTION—M. O. Baringer an
- Page 18 and 19:
Table 1.1 The GCOS Essential Climat
- Page 20 and 21:
S18 | juNE 2010
- Page 22 and 23:
Stratospheric TemperatureCloudiness
- Page 25:
Source Datasets Sectionhttp://www.p
- Page 28 and 29:
HOW do WE KNOW THE WORLD HAS WARMED
- Page 30 and 31:
Fig. 2.6. As for Fig. 2.1 but for l
- Page 32 and 33:
Fig. 2.10. Change in TCWV from 2008
- Page 34 and 35:
Precipitation anomalies in 2009, ov
- Page 36 and 37:
Fig. 2.18. Seasonal SCE anomalies (
- Page 38 and 39:
USING SI-TRACABLE GLOBAL POSITIONIN
- Page 40 and 41:
6) Lake levels—C. BirkettLake vol
- Page 42 and 43:
Fig. 2.30. (a) The daily AO index f
- Page 45 and 46:
(C) Carbon monoxide (CO)There has b
- Page 47 and 48:
Table 2.5. Mixing ratios, radiative
- Page 50 and 51: the mid-1990s but has since levelle
- Page 52 and 53: with all 42 glaciers observed retre
- Page 54 and 55: of 0.1° and 5 days (Kaiser et al.
- Page 56 and 57: Fig. 3.1. (a) Yearly mean SSTAs in
- Page 58 and 59: (Fig. 3.3c). It is interesting that
- Page 60 and 61: strong there, consistent with anoma
- Page 62 and 63: cont'RECENT ADVANCES IN OUR UNDERST
- Page 64 and 65: is to cause SST to rise if oceanic
- Page 66 and 67: egions around the subtropical salin
- Page 68 and 69: Fig 3.17. Principal empirical ortho
- Page 70 and 71: Fig. 3.19. Daily estimates of the s
- Page 72 and 73: Fig. 3.22. (top) The 2009 SSH anoma
- Page 74 and 75: to update the CO 2climatology, ther
- Page 76 and 77: µmol kg -1 or about half of the ac
- Page 78 and 79: Fig. 3.31. (a) Average MODIS-Aqua C
- Page 80 and 81: latitudes, chlorophyll and thermal
- Page 83 and 84: Fig. 4.4. (a) Anomalous 850-hPa win
- Page 85 and 86: (Fig. 4.6). These include four MJO
- Page 87 and 88: Fig. 4.8. NOAA’s ACE index expres
- Page 89 and 90: Fig. 4.14. ASO 2009: Anomalous 200-
- Page 91 and 92: Fig. 4.17. The tracks of all TCs th
- Page 93 and 94: Several previous studies have shown
- Page 95 and 96: followed by TY Linfa and TS Nangka
- Page 97 and 98: The Philippines were severely affec
- Page 99: The historical SIO TC data is proba
- Page 103 and 104: degree resolution NASA TRMM rainfal
- Page 105 and 106: F i g. 4.32 . TRMM (a) mean and (b)
- Page 107 and 108: THE forgotten sub-BASIN—THE centr
- Page 109 and 110: 5. THE ARCTIC—J. Richter-Menge, E
- Page 111 and 112: and North America (south of 55° la
- Page 113 and 114: Fig. 5.8. 2007-09 Atlantic water la
- Page 115 and 116: d. Sea ice cover—D. Perovich, R.
- Page 117 and 118: e. Land1) Vegetation—D. A. Walker
- Page 119 and 120: Fig. 5.18. Total annual river disch
- Page 121 and 122: negative SCD anomalies were evident
- Page 123 and 124: with records beginning in 1873, the
- Page 125 and 126: (QuikSCAT, 2000-09) microwave remot
- Page 127 and 128: 6. ANTARCTICAa. Overview—R. L. Fo
- Page 129 and 130: (SCAR) report ‘Antarctic Climate
- Page 131 and 132: these stations in April, August, an
- Page 133 and 134: e. 2008-2009 Seasonal melt extent a
- Page 135 and 136: positive ice-season duration anomal
- Page 137 and 138: 7. REGIONAL CLIMATESa. Introduction
- Page 139 and 140: first half of the year (January-Jun
- Page 141 and 142: its second wettest such period. Sev
- Page 143 and 144: California began the year with mode
- Page 145 and 146: The first drought occurred in March
- Page 147 and 148: Fig. 7.8. (a) Annual mean temperatu
- Page 149 and 150: Fig. 7.11. (a) Annual mean temperat
- Page 151 and 152:
EXTREME rainfall and the flood of t
- Page 153 and 154:
Fig. 7.14. Composite for standardiz
- Page 155 and 156:
Fig. 7.17. Daily maximum temperatur
- Page 157 and 158:
(ii) PrecipitationDecember to Febru
- Page 159 and 160:
For Zimbabwe, the rainfall season,
- Page 161 and 162:
Fig. 7.28. Annual mean temperature
- Page 163 and 164:
Fig. 7.31. Seasonal anomalies (1961
- Page 165 and 166:
(1706-2009), and new national recor
- Page 167 and 168:
cold in southern and central Finlan
- Page 169 and 170:
EXCEPTIONAL storm strikes northern
- Page 171 and 172:
7.32b). April was particularly mild
- Page 173 and 174:
to -44 о С) persisted in southern
- Page 175 and 176:
Fig. 7.39. Weather conditions in De
- Page 177 and 178:
on the 1971-2000 climatology) for a
- Page 179 and 180:
excess rainfall, while 11 subdivisi
- Page 181 and 182:
4) Southwest Asia(i) Iraq—M. Roge
- Page 183 and 184:
Wales. The warmth was particularly
- Page 185 and 186:
The most significant severe thunder
- Page 187 and 188:
mm thick, which fell on parts of No
- Page 189 and 190:
and Vanua Levu islands (Fiji) as a
- Page 191 and 192:
Table 7.5. Maximum temperature anom
- Page 193 and 194:
8. SEASONAL SUMMARIES—Mike Halper
- Page 195 and 196:
Fig. 8.5. Jun-Aug 2009 (top) surfac
- Page 197 and 198:
ACKNOWLEDGMENTSIn addition to the m
- Page 199 and 200:
CFCCFC-11CFC-12CH 4Chl satCIIFENClC
- Page 201 and 202:
OAFlux Objectively Analyzed Air-Sea
- Page 203 and 204:
Ashok, K., S. K. Behera, S. A. Rao,
- Page 205 and 206:
Cangialosi, J. P., and L. A. Avila,
- Page 207 and 208:
Francis, J. A., W. Chan, D. J. Leat
- Page 209 and 210:
Hudson, J. M. G., and G. H. R. Henr
- Page 211 and 212:
Landsea, C. W., and W. M. Gray, 199
- Page 213 and 214:
Meinen, C. S., M. O. Baringer, and
- Page 215 and 216:
Ramaswamy, V., M. D. Schwarzkopf, W
- Page 217 and 218:
——, ——, T. C. Peterson, and
- Page 219 and 220:
Wang, L., C. Derksen, and R. Brown,
- Page 224:
Monthly average temperature anomali