


You also want an ePaper? Increase the reach of your titles
YUMPU automatically turns print PDFs into web optimized ePapers that Google loves.
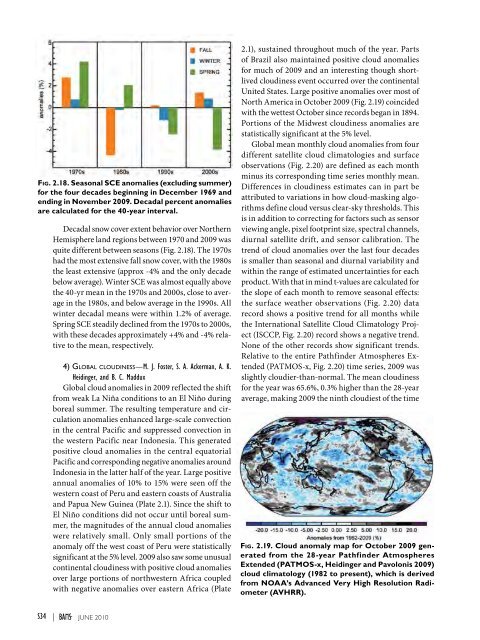
Fig. 2.18. Seasonal SCE anomalies (excluding summer)for the four decades beginning in December 1969 andending in November <strong>2009</strong>. Decadal percent anomaliesare calculated for the 40-year interval.Decadal snow cover extent behavior over NorthernHemisphere land regions between 1970 and <strong>2009</strong> wasquite different between seasons (Fig. 2.18). The 1970shad the most extensive fall snow cover, with the 1980sthe least extensive (approx -4% and the only decadebelow average). Winter SCE was almost equally abovethe 40-yr mean in the 1970s and 2000s, close to averagein the 1980s, and below average in the 1990s. Allwinter decadal means were within 1.2% of average.Spring SCE steadily declined from the 1970s to 2000s,with these decades approximately +4% and -4% relativeto the mean, respectively.4) Global cloudiness—M. J. Foster, S. A. Ackerman, A. K.Heidinger, and B. C. MadduxGlobal cloud anomalies in <strong>2009</strong> reflected the shiftfrom weak La Niña conditions to an El Niño duringboreal summer. The resulting temperature and circulationanomalies enhanced large-scale convectionin the central Pacific and suppressed convection inthe western Pacific near Indonesia. This generatedpositive cloud anomalies in the central equatorialPacific and corresponding negative anomalies aroundIndonesia in the latter half of the year. Large positiveannual anomalies of 10% to 15% were seen off thewestern coast of Peru and eastern coasts of Australiaand Papua New Guinea (Plate 2.1). Since the shift toEl Niño conditions did not occur until boreal summer,the magnitudes of the annual cloud anomalieswere relatively small. Only small portions of theanomaly off the west coast of Peru were statisticallysignificant at the 5% level. <strong>2009</strong> also saw some unusualcontinental cloudiness with positive cloud anomaliesover large portions of northwestern Africa coupledwith negative anomalies over eastern Africa (Plate2.1), sustained throughout much of the year. Partsof Brazil also maintained positive cloud anomaliesfor much of <strong>2009</strong> and an interesting though shortlivedcloudiness event occurred over the continentalUnited States. Large positive anomalies over most ofNorth America in October <strong>2009</strong> (Fig. 2.19) coincidedwith the wettest October since records began in 1894.Portions of the Midwest cloudiness anomalies arestatistically significant at the 5% level.Global mean monthly cloud anomalies from fourdifferent satellite cloud climatologies and surfaceobservations (Fig. 2.20) are defined as each monthminus its corresponding time series monthly mean.Differences in cloudiness estimates can in part beattributed to variations in how cloud-masking algorithmsdefine cloud versus clear-sky thresholds. Thisis in addition to correcting for factors such as sensorviewing angle, pixel footprint size, spectral channels,diurnal satellite drift, and sensor calibration. Thetrend of cloud anomalies over the last four decadesis smaller than seasonal and diurnal variability andwithin the range of estimated uncertainties for eachproduct. With that in mind t-values are calculated forthe slope of each month to remove seasonal effects:the surface weather observations (Fig. 2.20) datarecord shows a positive trend for all months whilethe International Satellite Cloud Climatology Project(ISCCP, Fig. 2.20) record shows a negative trend.None of the other records show significant trends.Relative to the entire Pathfinder Atmospheres Extended(PATMOS-x, Fig. 2.20) time series, <strong>2009</strong> wasslightly cloudier-than-normal. The mean cloudinessfor the year was 65.6%, 0.3% higher than the 28-yearaverage, making <strong>2009</strong> the ninth cloudiest of the timeFig. 2.19. Cloud anomaly map for October <strong>2009</strong> generatedfrom the 28-year Pathfinder AtmospheresExtended (PATMOS-x, Heidinger and Pavolonis <strong>2009</strong>)cloud climatology (1982 to present), which is derivedfrom NOAA’s Advanced Very High Resolution Radiometer(AVHRR).S34 | juNE 2010


