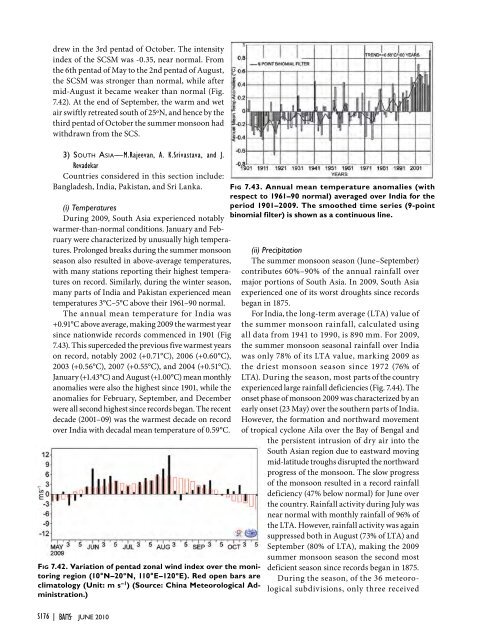
drew in the 3rd pentad of October. The intensityindex of the SCSM was -0.35, near normal. Fromthe 6th pentad of May to the 2nd pentad of August,the SCSM was stronger than normal, while aftermid-August it became weaker than normal (Fig.7.42). At the end of September, the warm and wetair swiftly retreated south of 25ºN, and hence by thethird pentad of October the summer monsoon hadwithdrawn from the SCS.3) South Asia—M.Rajeevan, A. K.Srivastava, and J.RevadekarCountries considered in this section include:Bangladesh, India, Pakistan, and Sri Lanka.(i) TemperaturesDuring <strong>2009</strong>, South Asia experienced notablywarmer-than-normal conditions. January and Februarywere characterized by unusually high temperatures.Prolonged breaks during the summer monsoonseason also resulted in above-average temperatures,with many stations reporting their highest temperatureson record. Similarly, during the winter season,many parts of India and Pakistan experienced meantemperatures 3°C–5°C above their 1961–90 normal.The annual mean temperature for India was+0.91°C above average, making <strong>2009</strong> the warmest yearsince nationwide records commenced in 1901 (Fig7.43). This superceded the previous five warmest yearson record, notably 2002 (+0.71°C), 2006 (+0.60°C),2003 (+0.56°C), 2007 (+0.55°C), and 2004 (+0.51°C).January (+1.43°C) and August (+1.00°C) mean monthlyanomalies were also the highest since 1901, while theanomalies for February, September, and Decemberwere all second highest since records began. The recentdecade (2001–09) was the warmest decade on recordover India with decadal mean temperature of 0.59°C.Fig 7.42. Variation of pentad zonal wind index over the monitoringregion (10°N–20ºN, 110°E–120ºE). Red open bars areclimatology (Unit: m s –1 ) (Source: China Meteorological Administration.)S176 | juNE 2010Fig 7.43. Annual mean temperature anomalies (withrespect to 1961–90 normal) averaged over India for theperiod 1901–<strong>2009</strong>. The smoothed time series (9-pointbinomial filter) is shown as a continuous line.(ii) PrecipitationThe summer monsoon season (June–September)contributes 60%–90% of the annual rainfall overmajor portions of South Asia. In <strong>2009</strong>, South Asiaexperienced one of its worst droughts since recordsbegan in 1875.For India, the long-term average (LTA) value ofthe summer monsoon rainfall, calculated usingall data from 1941 to 1990, is 890 mm. For <strong>2009</strong>,the summer monsoon seasonal rainfall over Indiawas only 78% of its LTA value, marking <strong>2009</strong> asthe driest monsoon season since 1972 (76% ofLTA). During the season, most parts of the countryexperienced large rainfall deficiencies (Fig. 7.44). Theonset phase of monsoon <strong>2009</strong> was characterized by anearly onset (23 May) over the southern parts of India.However, the formation and northward movementof tropical cyclone Aila over the Bay of Bengal andthe persistent intrusion of dry air into theSouth Asian region due to eastward movingmid-latitude troughs disrupted the northwardprogress of the monsoon. The slow progressof the monsoon resulted in a record rainfalldeficiency (47% below normal) for June overthe country. Rainfall activity during July wasnear normal with monthly rainfall of 96% ofthe LTA. However, rainfall activity was againsuppressed both in August (73% of LTA) andSeptember (80% of LTA), making the <strong>2009</strong>summer monsoon season the second mostdeficient season since records began in 1875.During the season, of the 36 meteorologicalsubdivisions, only three received
excess rainfall, while 11 subdivisions receivednormal rainfall and the remaining 22 subdivisionsreceived deficient rainfall. Out of 516meteorological districts for which rainfall datawere available, 59% of districts received 80% orless of their LTA. The <strong>2009</strong> summer monsoon wasalso characterized by strong intraseasonal variability(Fig. 7.45). Consistent with the observed decreasingtrend in the frequency of monsoon depressions overthe Indian Ocean, only four short-lived depressionsformed during the season, against the long-termaverage of seven.Over India, rainfall activity during the winter andpre-monsoon seasons was also below average. In <strong>2009</strong>,the annual rainfall over the country was the mostdeficient (20% below normal) since records beganin 1875, surpassing the previous record set in 1972.During the winter, rainfall over the country was 46%below normal, while during the pre-monsoon season(March–May), rainfall deficiency was 32%. While nodrought had occurred over South Asia in the previousdecade (1991–2000), the recent decade (2001–09) witnessedthree major droughts in 2002, 2004, and <strong>2009</strong>.During the <strong>2009</strong> summer monsoon season,Pakistan also experienced one of its worst droughts.The area-weighted summer monsoon rainfall overPakistan was 26% below its LTA. Mostparts of the country, with the exceptionof Karachi and Hyderabad (southwestSindh), experienced large rainfall deficienciesduring the season. As a result,the <strong>2009</strong> monsoon season rainfall wasthe third lowest in the most recentdecade (2001–09), after 2002 (54% deficiency)and 2004 (38%). Rainfall in July,August, and September was 9%, 41%,and 37% below normal, respectively.The observeddrought over theregion had severalpossible causes.These include theEl Niño-Modoki(wa r m i ng overthe Central Pacific;Ratnam et.al 2010), unusuallywarm equatorialIndian Ocean seasurface temperatures(Francis andGadgil 2010), and the formation of an anomalousblocking high over west Asia with the associated descentof dry air into the Indian region (Krishnamurtiet al. 2010).The northeast monsoon (NEM) sets in oversouthern peninsular India during October and overSri Lanka in late November. The NEM contributes30% to 50% of the annual rainfall over southernpeninsular India and Sri Lanka as a whole. The <strong>2009</strong>NEM seasonal rainfall over south peninsular Indiawas above normal (110% of LTA), consistent with theobserved relationship with El Niño. During the firstweek of November, heavy rainfall caused significantflooding and landslides in the southern Indian stateof Tamil Nadu, sadly leading to the deaths of about75 people. Above-normal rainfall was also reportedover Sri Lanka during the season.Fig. 7.44. Monsoonal (Jun–Sep) rainfall over India in <strong>2009</strong>. (a) actual, (b) normal (baseperiod) and, (c) anomalies (with respect to base period.)(iii) Notable eventsHeat wave/hot day conditions prevailed over partsof central and peninsular India during the first threeweeks of March; over the northern parts of the countryon many days during April; and over northern,central, and peninsular parts of the country duringthe second half of May. There were approximately 150Fig. 7.45. Daily standardized rainfall time series averaged over themonsoon region of India (1 June to 30 September <strong>2009</strong>).<strong>STATE</strong> <strong>OF</strong> <strong>THE</strong> <strong>CLIMATE</strong> <strong>IN</strong> <strong>2009</strong> juNE 2010 |S177
- Page 8 and 9:
Luo, Jing-Jia, Research Institute f
- Page 10 and 11:
Tedesco, Marco, Department Earth an
- Page 12 and 13:
4. THE TROPICS.....................
- Page 14 and 15:
ABSTRACT—M. O. Baringer, D. S. Ar
- Page 16 and 17:
I. INTRODUCTION—M. O. Baringer an
- Page 18 and 19:
Table 1.1 The GCOS Essential Climat
- Page 20 and 21:
S18 | juNE 2010
- Page 22 and 23:
Stratospheric TemperatureCloudiness
- Page 25:
Source Datasets Sectionhttp://www.p
- Page 28 and 29:
HOW do WE KNOW THE WORLD HAS WARMED
- Page 30 and 31:
Fig. 2.6. As for Fig. 2.1 but for l
- Page 32 and 33:
Fig. 2.10. Change in TCWV from 2008
- Page 34 and 35:
Precipitation anomalies in 2009, ov
- Page 36 and 37:
Fig. 2.18. Seasonal SCE anomalies (
- Page 38 and 39:
USING SI-TRACABLE GLOBAL POSITIONIN
- Page 40 and 41:
6) Lake levels—C. BirkettLake vol
- Page 42 and 43:
Fig. 2.30. (a) The daily AO index f
- Page 45 and 46:
(C) Carbon monoxide (CO)There has b
- Page 47 and 48:
Table 2.5. Mixing ratios, radiative
- Page 50 and 51:
the mid-1990s but has since levelle
- Page 52 and 53:
with all 42 glaciers observed retre
- Page 54 and 55:
of 0.1° and 5 days (Kaiser et al.
- Page 56 and 57:
Fig. 3.1. (a) Yearly mean SSTAs in
- Page 58 and 59:
(Fig. 3.3c). It is interesting that
- Page 60 and 61:
strong there, consistent with anoma
- Page 62 and 63:
cont'RECENT ADVANCES IN OUR UNDERST
- Page 64 and 65:
is to cause SST to rise if oceanic
- Page 66 and 67:
egions around the subtropical salin
- Page 68 and 69:
Fig 3.17. Principal empirical ortho
- Page 70 and 71:
Fig. 3.19. Daily estimates of the s
- Page 72 and 73:
Fig. 3.22. (top) The 2009 SSH anoma
- Page 74 and 75:
to update the CO 2climatology, ther
- Page 76 and 77:
µmol kg -1 or about half of the ac
- Page 78 and 79:
Fig. 3.31. (a) Average MODIS-Aqua C
- Page 80 and 81:
latitudes, chlorophyll and thermal
- Page 83 and 84:
Fig. 4.4. (a) Anomalous 850-hPa win
- Page 85 and 86:
(Fig. 4.6). These include four MJO
- Page 87 and 88:
Fig. 4.8. NOAA’s ACE index expres
- Page 89 and 90:
Fig. 4.14. ASO 2009: Anomalous 200-
- Page 91 and 92:
Fig. 4.17. The tracks of all TCs th
- Page 93 and 94:
Several previous studies have shown
- Page 95 and 96:
followed by TY Linfa and TS Nangka
- Page 97 and 98:
The Philippines were severely affec
- Page 99 and 100:
The historical SIO TC data is proba
- Page 101 and 102:
Fig. 4.26. Global anomalies of TCHP
- Page 103 and 104:
degree resolution NASA TRMM rainfal
- Page 105 and 106:
F i g. 4.32 . TRMM (a) mean and (b)
- Page 107 and 108:
THE forgotten sub-BASIN—THE centr
- Page 109 and 110:
5. THE ARCTIC—J. Richter-Menge, E
- Page 111 and 112:
and North America (south of 55° la
- Page 113 and 114:
Fig. 5.8. 2007-09 Atlantic water la
- Page 115 and 116:
d. Sea ice cover—D. Perovich, R.
- Page 117 and 118:
e. Land1) Vegetation—D. A. Walker
- Page 119 and 120:
Fig. 5.18. Total annual river disch
- Page 121 and 122:
negative SCD anomalies were evident
- Page 123 and 124:
with records beginning in 1873, the
- Page 125 and 126:
(QuikSCAT, 2000-09) microwave remot
- Page 127 and 128: 6. ANTARCTICAa. Overview—R. L. Fo
- Page 129 and 130: (SCAR) report ‘Antarctic Climate
- Page 131 and 132: these stations in April, August, an
- Page 133 and 134: e. 2008-2009 Seasonal melt extent a
- Page 135 and 136: positive ice-season duration anomal
- Page 137 and 138: 7. REGIONAL CLIMATESa. Introduction
- Page 139 and 140: first half of the year (January-Jun
- Page 141 and 142: its second wettest such period. Sev
- Page 143 and 144: California began the year with mode
- Page 145 and 146: The first drought occurred in March
- Page 147 and 148: Fig. 7.8. (a) Annual mean temperatu
- Page 149 and 150: Fig. 7.11. (a) Annual mean temperat
- Page 151 and 152: EXTREME rainfall and the flood of t
- Page 153 and 154: Fig. 7.14. Composite for standardiz
- Page 155 and 156: Fig. 7.17. Daily maximum temperatur
- Page 157 and 158: (ii) PrecipitationDecember to Febru
- Page 159 and 160: For Zimbabwe, the rainfall season,
- Page 161 and 162: Fig. 7.28. Annual mean temperature
- Page 163 and 164: Fig. 7.31. Seasonal anomalies (1961
- Page 165 and 166: (1706-2009), and new national recor
- Page 167 and 168: cold in southern and central Finlan
- Page 169 and 170: EXCEPTIONAL storm strikes northern
- Page 171 and 172: 7.32b). April was particularly mild
- Page 173 and 174: to -44 о С) persisted in southern
- Page 175 and 176: Fig. 7.39. Weather conditions in De
- Page 177: on the 1971-2000 climatology) for a
- Page 181 and 182: 4) Southwest Asia(i) Iraq—M. Roge
- Page 183 and 184: Wales. The warmth was particularly
- Page 185 and 186: The most significant severe thunder
- Page 187 and 188: mm thick, which fell on parts of No
- Page 189 and 190: and Vanua Levu islands (Fiji) as a
- Page 191 and 192: Table 7.5. Maximum temperature anom
- Page 193 and 194: 8. SEASONAL SUMMARIES—Mike Halper
- Page 195 and 196: Fig. 8.5. Jun-Aug 2009 (top) surfac
- Page 197 and 198: ACKNOWLEDGMENTSIn addition to the m
- Page 199 and 200: CFCCFC-11CFC-12CH 4Chl satCIIFENClC
- Page 201 and 202: OAFlux Objectively Analyzed Air-Sea
- Page 203 and 204: Ashok, K., S. K. Behera, S. A. Rao,
- Page 205 and 206: Cangialosi, J. P., and L. A. Avila,
- Page 207 and 208: Francis, J. A., W. Chan, D. J. Leat
- Page 209 and 210: Hudson, J. M. G., and G. H. R. Henr
- Page 211 and 212: Landsea, C. W., and W. M. Gray, 199
- Page 213 and 214: Meinen, C. S., M. O. Baringer, and
- Page 215 and 216: Ramaswamy, V., M. D. Schwarzkopf, W
- Page 217 and 218: ——, ——, T. C. Peterson, and
- Page 219 and 220: Wang, L., C. Derksen, and R. Brown,
- Page 224: Monthly average temperature anomali