


You also want an ePaper? Increase the reach of your titles
YUMPU automatically turns print PDFs into web optimized ePapers that Google loves.
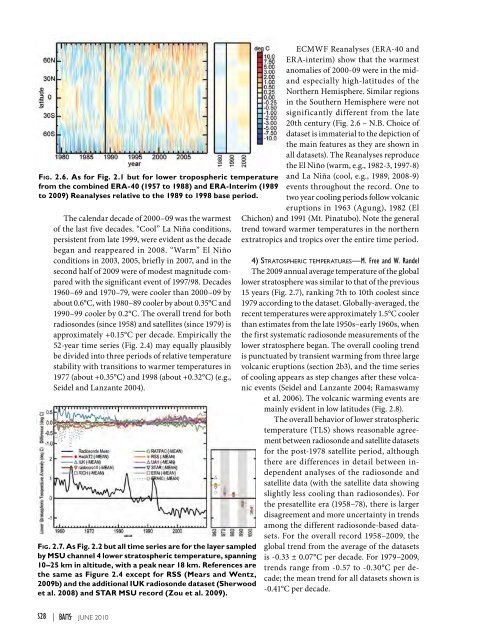
Fig. 2.6. As for Fig. 2.1 but for lower tropospheric temperaturefrom the combined ERA-40 (1957 to 1988) and ERA-Interim (1989to <strong>2009</strong>) Reanalyses relative to the 1989 to 1998 base period.The calendar decade of 2000–09 was the warmestof the last five decades. “Cool” La Niña conditions,persistent from late 1999, were evident as the decadebegan and reappeared in 2008. “Warm” El Niñoconditions in 2003, 2005, briefly in 2007, and in thesecond half of <strong>2009</strong> were of modest magnitude comparedwith the significant event of 1997/98. Decades1960 –69 and 1970–79, were cooler than 2000–09 byabout 0.6°C, with 1980–89 cooler by about 0.35°C and1990–99 cooler by 0.2°C. The overall trend for bothradiosondes (since 1958) and satellites (since 1979) isapproximately +0.15°C per decade. Empirically the52-year time series (Fig. 2.4) may equally plausiblybe divided into three periods of relative temperaturestability with transitions to warmer temperatures in1977 (about +0.35°C) and 1998 (about +0.32°C) (e.g.,Seidel and Lanzante 2004).Fig. 2.7. As Fig. 2.2 but all time series are for the layer sampledby MSU channel 4 lower stratospheric temperature, spanning10–25 km in altitude, with a peak near 18 km. References arethe same as Figure 2.4 except for RSS (Mears and Wentz,<strong>2009</strong>b) and the additional IUK radiosonde dataset (Sherwoodet al. 2008) and STAR MSU record (Zou et al. <strong>2009</strong>).ECMWF Reanalyses (ERA-40 andERA-interim) show that the warmestanomalies of 2000-09 were in the midandespecially high-latitudes of theNorthern Hemisphere. Similar regionsin the Southern Hemisphere were notsignificantly different from the late20th century (Fig. 2.6 – N.B. Choice ofdataset is immaterial to the depiction ofthe main features as they are shown inall datasets). The Reanalyses reproducethe El Niño (warm, e.g., 1982-3, 1997-8)and La Niña (cool, e.g., 1989, 2008-9)events throughout the record. One totwo year cooling periods follow volcaniceruptions in 1963 (Agung), 1982 (ElChichon) and 1991 (Mt. Pinatubo). Note the generaltrend toward warmer temperatures in the northernextratropics and tropics over the entire time period.4) Stratospheric temperatures—M. Free and W. RandelThe <strong>2009</strong> annual average temperature of the globallower stratosphere was similar to that of the previous15 years (Fig. 2.7), ranking 7th to 10th coolest since1979 according to the dataset. Globally-averaged, therecent temperatures were approximately 1.5°C coolerthan estimates from the late 1950s–early 1960s, whenthe first systematic radiosonde measurements of thelower stratosphere began. The overall cooling trendis punctuated by transient warming from three largevolcanic eruptions (section 2b3), and the time seriesof cooling appears as step changes after these volcanicevents (Seidel and Lanzante 2004; Ramaswamyet al. 2006). The volcanic warming events aremainly evident in low latitudes (Fig. 2.8).The overall behavior of lower stratospherictemperature (TLS) shows reasonable agreementbetween radiosonde and satellite datasetsfor the post-1978 satellite period, althoughthere are differences in detail between independentanalyses of the radiosonde andsatellite data (with the satellite data showingslightly less cooling than radiosondes). Forthe presatellite era (1958–78), there is largerdisagreement and more uncertainty in trendsamong the different radiosonde-based datasets.For the overall record 1958–<strong>2009</strong>, theglobal trend from the average of the datasetsis -0.33 ± 0.07°C per decade. For 1979–<strong>2009</strong>,trends range from -0.57 to -0.30°C per decade;the mean trend for all datasets shown is-0.41°C per decade.S28 | juNE 2010


