


Create successful ePaper yourself
Turn your PDF publications into a flip-book with our unique Google optimized e-Paper software.
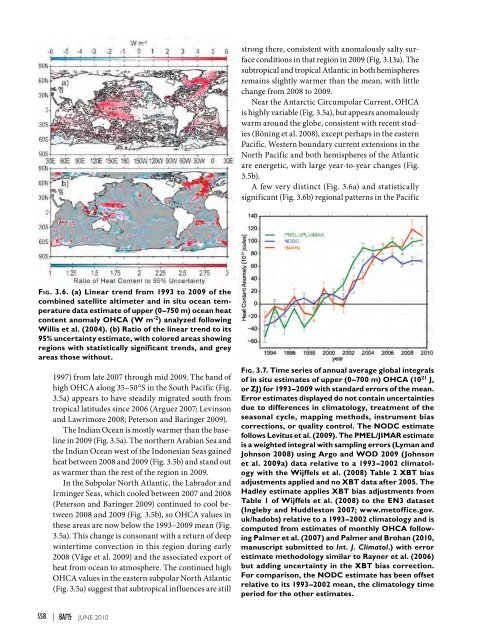
strong there, consistent with anomalously salty surfaceconditions in that region in <strong>2009</strong> (Fig. 3.13a). Thesubtropical and tropical Atlantic in both hemispheresremains slightly warmer than the mean, with littlechange from 2008 to <strong>2009</strong>.Near the Antarctic Circumpolar Current, OHCAis highly variable (Fig. 3.5a), but appears anomalouslywarm around the globe, consistent with recent studies(Böning et al. 2008), except perhaps in the easternPacific. Western boundary current extensions in theNorth Pacific and both hemispheres of the Atlanticare energetic, with large year-to-year changes (Fig.3.5b).A few very distinct (Fig. 3.6a) and statisticallysignificant (Fig. 3.6b) regional patterns in the PacificFig. 3.6. (a) Linear trend from 1993 to <strong>2009</strong> of thecombined satellite altimeter and in situ ocean temperaturedata estimate of upper (0–750 m) ocean heatcontent anomaly OHCA (W m -2 ) analyzed followingWillis et al. (2004). (b) Ratio of the linear trend to its95% uncertainty estimate, with colored areas showingregions with statistically significant trends, and greyareas those without.1997) from late 2007 through mid <strong>2009</strong>. The band ofhigh OHCA along 35–50°S in the South Pacific (Fig.3.5a) appears to have steadily migrated south fromtropical latitudes since 2006 (Arguez 2007; Levinsonand Lawrimore 2008; Peterson and Baringer <strong>2009</strong>).The Indian Ocean is mostly warmer than the baselinein <strong>2009</strong> (Fig. 3.5a). The northern Arabian Sea andthe Indian Ocean west of the Indonesian Seas gainedheat between 2008 and <strong>2009</strong> (Fig. 3.5b) and stand outas warmer than the rest of the region in <strong>2009</strong>.In the Subpolar North Atlantic, the Labrador andIrminger Seas, which cooled between 2007 and 2008(Peterson and Baringer <strong>2009</strong>) continued to cool between2008 and <strong>2009</strong> (Fig. 3.5b), so OHCA values inthese areas are now below the 1993–<strong>2009</strong> mean (Fig.3.5a). This change is consonant with a return of deepwintertime convection in this region during early2008 (Våge et al. <strong>2009</strong>) and the associated export ofheat from ocean to atmosphere. The continued highOHCA values in the eastern subpolar North Atlantic(Fig. 3.5a) suggest that subtropical influences are stillFig. 3.7. Time series of annual average global integralsof in situ estimates of upper (0–700 m) OHCA (10 21 J,or ZJ) for 1993–<strong>2009</strong> with standard errors of the mean.Error estimates displayed do not contain uncertaintiesdue to differences in climatology, treatment of theseasonal cycle, mapping methods, instrument biascorrections, or quality control. The NODC estimatefollows Levitus et al. (<strong>2009</strong>). The PMEL/JIMAR estimateis a weighted integral with sampling errors (Lyman andJohnson 2008) using Argo and WOD <strong>2009</strong> (Johnsonet al. <strong>2009</strong>a) data relative to a 1993–2002 climatologywith the Wijffels et al. (2008) Table 2 XBT biasadjustments applied and no XBT data after 2005. TheHadley estimate applies XBT bias adjustments fromTable 1 of Wijffels et al. (2008) to the EN3 dataset(Ingleby and Huddleston 2007; www.metoffice.gov.uk/hadobs) relative to a 1993–2002 climatology and iscomputed from estimates of monthly OHCA followingPalmer et al. (2007) and Palmer and Brohan (2010,manuscript submitted to Int. J. Climatol.) with errorestimate methodology similar to Rayner et al. (2006)but adding uncertainty in the XBT bias correction.For comparison, the NODC estimate has been offsetrelative to its 1993–2002 mean, the climatology timeperiod for the other estimates.S58 | juNE 2010


