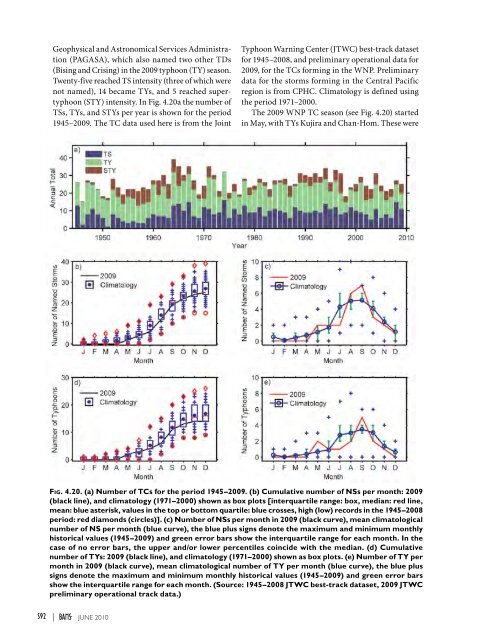
Geophysical and Astronomical Services Administration(PAGASA), which also named two other TDs(Bising and Crising) in the <strong>2009</strong> typhoon (TY) season.Twenty-five reached TS intensity (three of which werenot named), 14 became TYs, and 5 reached supertyphoon(STY) intensity. In Fig. 4.20a the number ofTSs, TYs, and STYs per year is shown for the period1945–<strong>2009</strong>. The TC data used here is from the JointTyphoon Warning Center (JTWC) best-track datasetfor 1945–2008, and preliminary operational data for<strong>2009</strong>, for the TCs forming in the WNP. Preliminarydata for the storms forming in the Central Pacificregion is from CPHC. Climatology is defined usingthe period 1971–2000.The <strong>2009</strong> WNP TC season (see Fig. 4.20) startedin May, with TYs Kujira and Chan-Hom. These wereFig. 4.20. (a) Number of TCs for the period 1945–<strong>2009</strong>. (b) Cumulative number of NSs per month: <strong>2009</strong>(black line), and climatology (1971–2000) shown as box plots [interquartile range: box, median: red line,mean: blue asterisk, values in the top or bottom quartile: blue crosses, high (low) records in the 1945–2008period: red diamonds (circles)]. (c) Number of NSs per month in <strong>2009</strong> (black curve), mean climatologicalnumber of NS per month (blue curve), the blue plus signs denote the maximum and minimum monthlyhistorical values (1945–<strong>2009</strong>) and green error bars show the interquartile range for each month. In thecase of no error bars, the upper and/or lower percentiles coincide with the median. (d) Cumulativenumber of TYs: <strong>2009</strong> (black line), and climatology (1971–2000) shown as box plots. (e) Number of TY permonth in <strong>2009</strong> (black curve), mean climatological number of TY per month (blue curve), the blue plussigns denote the maximum and minimum monthly historical values (1945–<strong>2009</strong>) and green error barsshow the interquartile range for each month. (Source: 1945–2008 JTWC best-track dataset, <strong>2009</strong> JTWCpreliminary operational track data.)S92 | juNE 2010
followed by TY Linfa and TS Nangka in June. JulyTC activity was below-normal, with only two TCsreaching TS intensity, TS Soudelor and TY Molave.On average for the month of July there are four NSsthat develop, of which three reach TY intensity. InAugust, the TC activity was higher than in July, withthree TSs (Goni, Etau, and Krovanh) and two TYs(Morakot and Vamco) forming in the WNP. In addition,two Central Pacific TCs, TS Maka and TD 02Ccrossed into the region. The most active month in TCgenesis numbers was September, with one TD (Mujigae),two TSs (Dujuan and 18W), two TYs (Koppuand Ketsana), and three STYs (Choi-Wan, Parmaand Melor) forming in the WNP. The seven NSsand three STYs that occurred in September tied theprevious historical record of the number of NSs andSTYs in that month. The TC activity in October wasslightly below-average, with one TS (Nepartak), oneTY (Mirinae), and one STY (Lupit) occurring in thebasin. The last STY (Nida) of the <strong>2009</strong> season formedin November, along with two TDs (24W and 27W)and one non-named TS (25W). The season finishedwith the formation of TS 28W in early December.The total number of TCs (30), NSs (25), and TYs(14) in <strong>2009</strong> were all below the median but equal toor above the 25th percentile of the climatologicaldistributions (median: 30.5 TCs, 27 NSs, and 16TYs, 25th percentile: 27 TCs, 24 NSs, and 14 TYs).The cumulative distributions of NSs (Fig. 4.20b) andTYs (Fig. 4.20c) show a slow season start, with theactivity increasing in May, below-normal activity inJuly and August, and the high activity in Septemberleading to slightly-below normal values for the seasonas a whole for NS and TY numbers. In contrast, thenumber of STYs in <strong>2009</strong> (five) was in the top quartileof the climatological distribution.The ACE in the WNP (Fig. 4.21) reflects well theactivity and number of TCs. The ACE value for the<strong>2009</strong> season was very near the climatological median(Fig. 4.21a), only slightly above the median, due to thevery low value of ACE in July, which was not totallycompensated by the high October and NovemberACE values. The May ACE was in the top quartile ofclimatology and the November ACE was very closeto the 75th percentile of the climatology. July andOctober were complementary months, with the JulyACE value being the 5th lowest and the October ACEbeing the 5th highest value in the historical recordfor the respective months. The ACE values of the twostrongest storms in <strong>2009</strong>, STYs Melor and Nida arein the top 5th percentile of the historical record andthe climatological distribution. Ninety percent of theACE in November is due to STY Nida, while 64% ofthe September ACE is due to STY Choi-Wan, and 37%of the October ACE is due to STY Melor.There were 129 days with TCs and 122 days withNSs in <strong>2009</strong> in the WNP, both in the bottom quartileof the climatological distribution (medians 161.5 and144.25 days, respectively). From these, there were 110days with typhoons, slightly below the climatologicalmedian of 120.4 days. There were 22.25 days withintense TYs (categories 3–5), above the climatologicalmedian of 19.4 days. Climatologically, 74% (11%)of the TC days consist of days with (intense) TYs.In <strong>2009</strong> these ratios were much higher, 85.3% and17.25%, respectively, pointing to a more frequent occurrenceof intense and STYs in the <strong>2009</strong> TC season.The median lifetime of NSs in <strong>2009</strong> was 6.5 days,below the median lifetime of 8 days for all years.From the 25 NSs, 17 had a duration below the median,Fig. 4.21. (a) ACE Index per year in the WesternNorth Pacific for the years 1945–<strong>2009</strong>. The solid greenline indicates the median for the years 1971–2000climatology, and the dashed green lines show the 25thand 75th percentiles. (b) ACE index per month in <strong>2009</strong>(red line) and the median in the years 1971–2000 (blueline), where the green error bars indicate the 25thand 75th percentiles. In the case of no error bars,the upper and/or lower percentiles coincide with themedian. The blue plus signs (+) denote the maximumand minimum values during the period 1945–<strong>2009</strong>.(Source: 1945–2008 JTWC best-track dataset, <strong>2009</strong>JTWC preliminary operational track data.)<strong>STATE</strong> <strong>OF</strong> <strong>THE</strong> <strong>CLIMATE</strong> <strong>IN</strong> <strong>2009</strong> juNE 2010 |S93
- Page 8 and 9:
Luo, Jing-Jia, Research Institute f
- Page 10 and 11:
Tedesco, Marco, Department Earth an
- Page 12 and 13:
4. THE TROPICS.....................
- Page 14 and 15:
ABSTRACT—M. O. Baringer, D. S. Ar
- Page 16 and 17:
I. INTRODUCTION—M. O. Baringer an
- Page 18 and 19:
Table 1.1 The GCOS Essential Climat
- Page 20 and 21:
S18 | juNE 2010
- Page 22 and 23:
Stratospheric TemperatureCloudiness
- Page 25:
Source Datasets Sectionhttp://www.p
- Page 28 and 29:
HOW do WE KNOW THE WORLD HAS WARMED
- Page 30 and 31:
Fig. 2.6. As for Fig. 2.1 but for l
- Page 32 and 33:
Fig. 2.10. Change in TCWV from 2008
- Page 34 and 35:
Precipitation anomalies in 2009, ov
- Page 36 and 37:
Fig. 2.18. Seasonal SCE anomalies (
- Page 38 and 39:
USING SI-TRACABLE GLOBAL POSITIONIN
- Page 40 and 41:
6) Lake levels—C. BirkettLake vol
- Page 42 and 43:
Fig. 2.30. (a) The daily AO index f
- Page 45 and 46: (C) Carbon monoxide (CO)There has b
- Page 47 and 48: Table 2.5. Mixing ratios, radiative
- Page 50 and 51: the mid-1990s but has since levelle
- Page 52 and 53: with all 42 glaciers observed retre
- Page 54 and 55: of 0.1° and 5 days (Kaiser et al.
- Page 56 and 57: Fig. 3.1. (a) Yearly mean SSTAs in
- Page 58 and 59: (Fig. 3.3c). It is interesting that
- Page 60 and 61: strong there, consistent with anoma
- Page 62 and 63: cont'RECENT ADVANCES IN OUR UNDERST
- Page 64 and 65: is to cause SST to rise if oceanic
- Page 66 and 67: egions around the subtropical salin
- Page 68 and 69: Fig 3.17. Principal empirical ortho
- Page 70 and 71: Fig. 3.19. Daily estimates of the s
- Page 72 and 73: Fig. 3.22. (top) The 2009 SSH anoma
- Page 74 and 75: to update the CO 2climatology, ther
- Page 76 and 77: µmol kg -1 or about half of the ac
- Page 78 and 79: Fig. 3.31. (a) Average MODIS-Aqua C
- Page 80 and 81: latitudes, chlorophyll and thermal
- Page 83 and 84: Fig. 4.4. (a) Anomalous 850-hPa win
- Page 85 and 86: (Fig. 4.6). These include four MJO
- Page 87 and 88: Fig. 4.8. NOAA’s ACE index expres
- Page 89 and 90: Fig. 4.14. ASO 2009: Anomalous 200-
- Page 91 and 92: Fig. 4.17. The tracks of all TCs th
- Page 93: Several previous studies have shown
- Page 97 and 98: The Philippines were severely affec
- Page 99 and 100: The historical SIO TC data is proba
- Page 101 and 102: Fig. 4.26. Global anomalies of TCHP
- Page 103 and 104: degree resolution NASA TRMM rainfal
- Page 105 and 106: F i g. 4.32 . TRMM (a) mean and (b)
- Page 107 and 108: THE forgotten sub-BASIN—THE centr
- Page 109 and 110: 5. THE ARCTIC—J. Richter-Menge, E
- Page 111 and 112: and North America (south of 55° la
- Page 113 and 114: Fig. 5.8. 2007-09 Atlantic water la
- Page 115 and 116: d. Sea ice cover—D. Perovich, R.
- Page 117 and 118: e. Land1) Vegetation—D. A. Walker
- Page 119 and 120: Fig. 5.18. Total annual river disch
- Page 121 and 122: negative SCD anomalies were evident
- Page 123 and 124: with records beginning in 1873, the
- Page 125 and 126: (QuikSCAT, 2000-09) microwave remot
- Page 127 and 128: 6. ANTARCTICAa. Overview—R. L. Fo
- Page 129 and 130: (SCAR) report ‘Antarctic Climate
- Page 131 and 132: these stations in April, August, an
- Page 133 and 134: e. 2008-2009 Seasonal melt extent a
- Page 135 and 136: positive ice-season duration anomal
- Page 137 and 138: 7. REGIONAL CLIMATESa. Introduction
- Page 139 and 140: first half of the year (January-Jun
- Page 141 and 142: its second wettest such period. Sev
- Page 143 and 144: California began the year with mode
- Page 145 and 146:
The first drought occurred in March
- Page 147 and 148:
Fig. 7.8. (a) Annual mean temperatu
- Page 149 and 150:
Fig. 7.11. (a) Annual mean temperat
- Page 151 and 152:
EXTREME rainfall and the flood of t
- Page 153 and 154:
Fig. 7.14. Composite for standardiz
- Page 155 and 156:
Fig. 7.17. Daily maximum temperatur
- Page 157 and 158:
(ii) PrecipitationDecember to Febru
- Page 159 and 160:
For Zimbabwe, the rainfall season,
- Page 161 and 162:
Fig. 7.28. Annual mean temperature
- Page 163 and 164:
Fig. 7.31. Seasonal anomalies (1961
- Page 165 and 166:
(1706-2009), and new national recor
- Page 167 and 168:
cold in southern and central Finlan
- Page 169 and 170:
EXCEPTIONAL storm strikes northern
- Page 171 and 172:
7.32b). April was particularly mild
- Page 173 and 174:
to -44 о С) persisted in southern
- Page 175 and 176:
Fig. 7.39. Weather conditions in De
- Page 177 and 178:
on the 1971-2000 climatology) for a
- Page 179 and 180:
excess rainfall, while 11 subdivisi
- Page 181 and 182:
4) Southwest Asia(i) Iraq—M. Roge
- Page 183 and 184:
Wales. The warmth was particularly
- Page 185 and 186:
The most significant severe thunder
- Page 187 and 188:
mm thick, which fell on parts of No
- Page 189 and 190:
and Vanua Levu islands (Fiji) as a
- Page 191 and 192:
Table 7.5. Maximum temperature anom
- Page 193 and 194:
8. SEASONAL SUMMARIES—Mike Halper
- Page 195 and 196:
Fig. 8.5. Jun-Aug 2009 (top) surfac
- Page 197 and 198:
ACKNOWLEDGMENTSIn addition to the m
- Page 199 and 200:
CFCCFC-11CFC-12CH 4Chl satCIIFENClC
- Page 201 and 202:
OAFlux Objectively Analyzed Air-Sea
- Page 203 and 204:
Ashok, K., S. K. Behera, S. A. Rao,
- Page 205 and 206:
Cangialosi, J. P., and L. A. Avila,
- Page 207 and 208:
Francis, J. A., W. Chan, D. J. Leat
- Page 209 and 210:
Hudson, J. M. G., and G. H. R. Henr
- Page 211 and 212:
Landsea, C. W., and W. M. Gray, 199
- Page 213 and 214:
Meinen, C. S., M. O. Baringer, and
- Page 215 and 216:
Ramaswamy, V., M. D. Schwarzkopf, W
- Page 217 and 218:
——, ——, T. C. Peterson, and
- Page 219 and 220:
Wang, L., C. Derksen, and R. Brown,
- Page 224:
Monthly average temperature anomali