


Create successful ePaper yourself
Turn your PDF publications into a flip-book with our unique Google optimized e-Paper software.
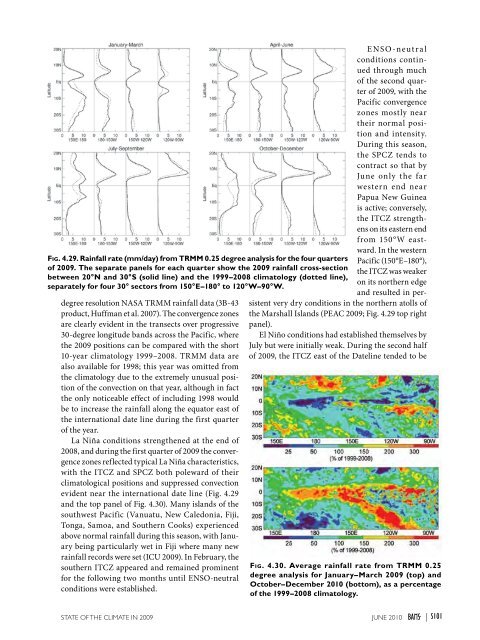
degree resolution NASA TRMM rainfall data (3B-43product, Huffman et al. 2007). The convergence zonesare clearly evident in the transects over progressive30-degree longitude bands across the Pacific, wherethe <strong>2009</strong> positions can be compared with the short10-year climatology 1999–2008. TRMM data arealso available for 1998; this year was omitted fromthe climatology due to the extremely unusual positionof the convection on that year, although in factthe only noticeable effect of including 1998 wouldbe to increase the rainfall along the equator east ofthe international date line during the first quarterof the year.La Niña conditions strengthened at the end of2008, and during the first quarter of <strong>2009</strong> the convergencezones reflected typical La Niña characteristics,with the ITCZ and SPCZ both poleward of theirclimatological positions and suppressed convectionevident near the international date line (Fig. 4.29and the top panel of Fig. 4.30). Many islands of thesouthwest Pacific (Vanuatu, New Caledonia, Fiji,Tonga, Samoa, and Southern Cooks) experiencedabove normal rainfall during this season, with Januarybeing particularly wet in Fiji where many newrainfall records were set (ICU <strong>2009</strong>). In February, thesouthern ITCZ appeared and remained prominentfor the following two months until ENSO-neutralconditions were established.E NSO -neut r a lconditions continuedthrough muchof the second quarterof <strong>2009</strong>, with thePacific convergencezones mostly neartheir normal positionand intensity.During this season,the SPCZ tends tocontract so that byJune only the farwestern end nearPapua New Guineais active; conversely,the ITCZ strengthenson its eastern endfrom 150°W eastward.In the westernPacific (150°E–180°),the ITCZ was weakeron its northern edgeand resulted in persistentvery dry conditions in the northern atolls ofthe Marshall Islands (PEAC <strong>2009</strong>; Fig. 4.29 top rightpanel).El Niño conditions had established themselves byJuly but were initially weak. During the second halfof <strong>2009</strong>, the ITCZ east of the Dateline tended to beFig. 4.29. Rainfall rate (mm/day) from TRMM 0.25 degree analysis for the four quartersof <strong>2009</strong>. The separate panels for each quarter show the <strong>2009</strong> rainfall cross-sectionbetween 20°N and 30°S (solid line) and the 1999–2008 climatology (dotted line),separately for four 30° sectors from 150°E–180° to 120°W–90°W.Fig. 4.30. Average rainfall rate from TRMM 0.25degree analysis for January–March <strong>2009</strong> (top) andOctober–December 2010 (bottom), as a percentageof the 1999–2008 climatology.<strong>STATE</strong> <strong>OF</strong> <strong>THE</strong> <strong>CLIMATE</strong> <strong>IN</strong> <strong>2009</strong> juNE 2010 |S101


