tobal which damaged public services and basic infrastructurein the city. These events have become morefrequent in Venezuela during the last years.In <strong>2009</strong>, several extreme events occurred in Peru.On 11 April and 14 April, precipitation exceeded themonthly means in Jauja, Huayao, and Tarma. On 12July, 25 cm of snow was observed in Tumayhuarapaand Pampachiri (Andahuaylas, Southern Highlandsof Apurímac). On the first days of November, ninehours of continuous rainfall with winds of 50 km hr -1were reported in Nauta-Iquitos (Northern Amazonia).2) Tropical South America east of the Andes—J.A. Marengo, J. Ronchail, J. Baez, and L. M. AlvesCountries considered in this section include:Brazil, east Bolivia, Paraguay, and north Argentina.La Niña-like conditions were present in early<strong>2009</strong>, followed by the development of El Niño patternsstarting in June <strong>2009</strong>. During June–September,sea surface temperatures were generally about 1°Cwarmer than the long-term average across the centraland eastern equatorial Pacific. Considering the summertimemean of the 2000–09 decade for the tropicalregion east of the Andes, this decade showed lessrainfall (about 200 mm below normal) as comparedto 1980–90 (about 350 mm above than normal), whileair temperatures were 0.5°C to 2°C warmer. The annualmean temperature and total rainfall anomaliesare presented in Figs. 7.11a and 7.11b, respectively.(i) TemperatureMost of tropical South America east of the Andesexperienced a warm <strong>2009</strong> austral summer, with maximumtemperatures 3°C to 4°C warmer than normalin the South American monsoon area in southeasternBrazil and in the coastal region of northeast Brazil.Likewise, warm summer conditions (1°C to 2°C abovenormal) were observed in central and eastern Amazoniaand eastern Paraguay. In April, mean temperatureswere about 3°C–4°C above normal over westernParaguay and northern Argentina, with maximumtemperatures reaching 5°C higher than normal inParaguay. Average temperatures during May wereabout 2°C above normal in central Amazonia, northernParaguay and eastern Bolivia.In June, cooler-than-normal conditions (anomaliesof -0.5°C to -1°C) were observed in southern andsoutheastern Brazil, and some sectors of westernAmazonia, due to an episode of cold air intrusion.Maximum/minimum temperatures in southern Brazilwere 2°C–3°C cooler than normal, and frost wasreported in the elevated regions of southern Brazil.The cooling was also observed in Paraguay, whereminimum and maximum temperatures were about4°C and 1°C below normal, respectively.In July, cold temperature anomalies were detectedin eastern Amazonia, northeast Brazil, southernParaguay, and northern Argentina. Minimum temperatureswere 3°C colder than normal in southernBrazil and in some regions of southeastern Braziland western Amazonia and 4°C colder than normalin southern Paraguay. This cooling was due to a coldfront penetration during late July. In the city of SãoJoaquim, state of Santa Catarina in southern Brazil,temperature reached -6.2°C on 24 July. Cold temperatureanomalies also persisted over southern Paraguay.On the other hand, warm temperature anomalies(1°C–3°C) were detected in central and southeasternBrazil and over the Amazon region.In August, most of tropical South America east ofthe Andes was about 1°C–2°C warmer than normal.In September, the eastern coast of northeast Brazilwas about 3°C warmer than normal, while the rest ofthe tropical region was 1°C–2°C warmer than normal.October temperatures across most of tropicalSouth America were 1°C above normal, with thelargest warming over Amazonia and southeasternBrazil. In November, temperatures were warmerthan normal in southern and southeastern Braziland western Amazonia. The largest warming wasdetected over northern Paraguay where the meantemperatures were 4°C–5°C warmer than normal.In December, temperatures in most of tropical SouthAmerica east of the Andes were 1°C–2°C warmerthan normal, especially over northern and easternAmazonia and southeastern Brazil. In some regionsof southeastern Brazil, temperatures were 4°C warmerthan normal during the second week of December.(ii) PrecipitationMost of the austral summer and fall months werecharacterized by episodes of intense rainfall andfloods in large cities such as Sao Paulo and Rio deJaneiro, as well as in most of tropical South America,north of 5°S. This was due to the presence of the SouthAtlantic Convergence Zone (SACZ). NorthwesternAmazonia observed more than 200 mm above normal.This intense rainfall was the main cause of therecord high levels of the Rio Negro River in Manausin July (see sidebar), the highest level in 107 years ofmeasurements. Northeast Brazil was also severelyaffected by heavy rainfall and flooding in April andMay, otherwise the dry season was predominant inthat region.S148 | juNE 2010
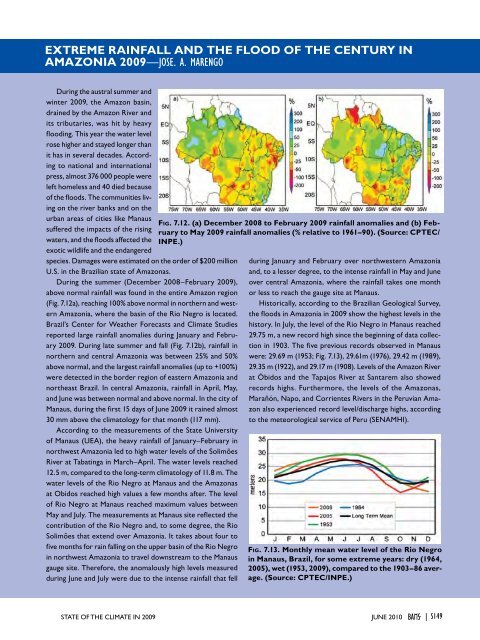
EXTREME rainfall and the flood of the century inAMAZONIA <strong>2009</strong>—JOSe. A. MarengoDuring the austral summer andwinter <strong>2009</strong>, the Amazon basin,drained by the Amazon River andits tributaries, was hit by heavyflooding. This year the water levelrose higher and stayed longer thanit has in several decades. Accordingto national and internationalpress, almost 376 000 people wereleft homeless and 40 died becauseof the floods. The communities livingon the river banks and on theurban areas of cities like Manaussuffered the impacts of the risingwaters, and the floods affected theexotic wildlife and the endangeredspecies. Damages were estimated on the order of $200 millionU.S. in the Brazilian state of Amazonas.During the summer (December 2008–February <strong>2009</strong>),above normal rainfall was found in the entire Amazon region(Fig. 7.12a), reaching 100% above normal in northern and westernAmazonia, where the basin of the Rio Negro is located.Brazil’s Center for Weather Forecasts and Climate Studiesreported large rainfall anomalies during January and February<strong>2009</strong>. During late summer and fall (Fig. 7.12b), rainfall innorthern and central Amazonia was between 25% and 50%above normal, and the largest rainfall anomalies (up to +100%)were detected in the border region of eastern Amazonia andnortheast Brazil. In central Amazonia, rainfall in April, May,and June was between normal and above normal. In the city ofManaus, during the first 15 days of June <strong>2009</strong> it rained almost30 mm above the climatology for that month (117 mm).According to the measurements of the State Universityof Manaus (UEA), the heavy rainfall of January–February innorthwest Amazonia led to high water levels of the SolimõesRiver at Tabatinga in March–April. The water levels reached12.5 m, compared to the long-term climatology of 11.8 m. Thewater levels of the Rio Negro at Manaus and the Amazonasat Obidos reached high values a few months after. The levelof Rio Negro at Manaus reached maximum values betweenMay and July. The measurements at Manaus site reflected thecontribution of the Rio Negro and, to some degree, the RioSolimões that extend over Amazonia. It takes about four tofive months for rain falling on the upper basin of the Rio Negroin northwest Amazonia to travel downstream to the Manausgauge site. Therefore, the anomalously high levels measuredduring June and July were due to the intense rainfall that fellFig. 7.12. (a) December 2008 to February <strong>2009</strong> rainfall anomalies and (b) Februaryto May <strong>2009</strong> rainfall anomalies (% relative to 1961–90). (Source: CPTEC/<strong>IN</strong>PE.)during January and February over northwestern Amazoniaand, to a lesser degree, to the intense rainfall in May and Juneover central Amazonia, where the rainfall takes one monthor less to reach the gauge site at Manaus.Historically, according to the Brazilian Geological Survey,the floods in Amazonia in <strong>2009</strong> show the highest levels in thehistory. In July, the level of the Rio Negro in Manaus reached29.75 m, a new record high since the beginning of data collectionin 1903. The five previous records observed in Manauswere: 29.69 m (1953; Fig. 7.13), 29.61m (1976), 29.42 m (1989),29.35 m (1922), and 29.17 m (1908). Levels of the Amazon Riverat Óbidos and the Tapajos River at Santarem also showedrecords highs. Furthermore, the levels of the Amazonas,Marañón, Napo, and Corrientes Rivers in the Peruvian Amazonalso experienced record level/discharge highs, accordingto the meteorological service of Peru (SENAMHI).Fig. 7.13. Monthly mean water level of the Rio Negroin Manaus, Brazil, for some extreme years: dry (1964,2005), wet (1953, <strong>2009</strong>), compared to the 1903–86 average.(Source: CPTEC/<strong>IN</strong>PE.)<strong>STATE</strong> <strong>OF</strong> <strong>THE</strong> <strong>CLIMATE</strong> <strong>IN</strong> <strong>2009</strong> juNE 2010 |S149
- Page 8 and 9:
Luo, Jing-Jia, Research Institute f
- Page 10 and 11:
Tedesco, Marco, Department Earth an
- Page 12 and 13:
4. THE TROPICS.....................
- Page 14 and 15:
ABSTRACT—M. O. Baringer, D. S. Ar
- Page 16 and 17:
I. INTRODUCTION—M. O. Baringer an
- Page 18 and 19:
Table 1.1 The GCOS Essential Climat
- Page 20 and 21:
S18 | juNE 2010
- Page 22 and 23:
Stratospheric TemperatureCloudiness
- Page 25:
Source Datasets Sectionhttp://www.p
- Page 28 and 29:
HOW do WE KNOW THE WORLD HAS WARMED
- Page 30 and 31:
Fig. 2.6. As for Fig. 2.1 but for l
- Page 32 and 33:
Fig. 2.10. Change in TCWV from 2008
- Page 34 and 35:
Precipitation anomalies in 2009, ov
- Page 36 and 37:
Fig. 2.18. Seasonal SCE anomalies (
- Page 38 and 39:
USING SI-TRACABLE GLOBAL POSITIONIN
- Page 40 and 41:
6) Lake levels—C. BirkettLake vol
- Page 42 and 43:
Fig. 2.30. (a) The daily AO index f
- Page 45 and 46:
(C) Carbon monoxide (CO)There has b
- Page 47 and 48:
Table 2.5. Mixing ratios, radiative
- Page 50 and 51:
the mid-1990s but has since levelle
- Page 52 and 53:
with all 42 glaciers observed retre
- Page 54 and 55:
of 0.1° and 5 days (Kaiser et al.
- Page 56 and 57:
Fig. 3.1. (a) Yearly mean SSTAs in
- Page 58 and 59:
(Fig. 3.3c). It is interesting that
- Page 60 and 61:
strong there, consistent with anoma
- Page 62 and 63:
cont'RECENT ADVANCES IN OUR UNDERST
- Page 64 and 65:
is to cause SST to rise if oceanic
- Page 66 and 67:
egions around the subtropical salin
- Page 68 and 69:
Fig 3.17. Principal empirical ortho
- Page 70 and 71:
Fig. 3.19. Daily estimates of the s
- Page 72 and 73:
Fig. 3.22. (top) The 2009 SSH anoma
- Page 74 and 75:
to update the CO 2climatology, ther
- Page 76 and 77:
µmol kg -1 or about half of the ac
- Page 78 and 79:
Fig. 3.31. (a) Average MODIS-Aqua C
- Page 80 and 81:
latitudes, chlorophyll and thermal
- Page 83 and 84:
Fig. 4.4. (a) Anomalous 850-hPa win
- Page 85 and 86:
(Fig. 4.6). These include four MJO
- Page 87 and 88:
Fig. 4.8. NOAA’s ACE index expres
- Page 89 and 90:
Fig. 4.14. ASO 2009: Anomalous 200-
- Page 91 and 92:
Fig. 4.17. The tracks of all TCs th
- Page 93 and 94:
Several previous studies have shown
- Page 95 and 96:
followed by TY Linfa and TS Nangka
- Page 97 and 98:
The Philippines were severely affec
- Page 99 and 100: The historical SIO TC data is proba
- Page 101 and 102: Fig. 4.26. Global anomalies of TCHP
- Page 103 and 104: degree resolution NASA TRMM rainfal
- Page 105 and 106: F i g. 4.32 . TRMM (a) mean and (b)
- Page 107 and 108: THE forgotten sub-BASIN—THE centr
- Page 109 and 110: 5. THE ARCTIC—J. Richter-Menge, E
- Page 111 and 112: and North America (south of 55° la
- Page 113 and 114: Fig. 5.8. 2007-09 Atlantic water la
- Page 115 and 116: d. Sea ice cover—D. Perovich, R.
- Page 117 and 118: e. Land1) Vegetation—D. A. Walker
- Page 119 and 120: Fig. 5.18. Total annual river disch
- Page 121 and 122: negative SCD anomalies were evident
- Page 123 and 124: with records beginning in 1873, the
- Page 125 and 126: (QuikSCAT, 2000-09) microwave remot
- Page 127 and 128: 6. ANTARCTICAa. Overview—R. L. Fo
- Page 129 and 130: (SCAR) report ‘Antarctic Climate
- Page 131 and 132: these stations in April, August, an
- Page 133 and 134: e. 2008-2009 Seasonal melt extent a
- Page 135 and 136: positive ice-season duration anomal
- Page 137 and 138: 7. REGIONAL CLIMATESa. Introduction
- Page 139 and 140: first half of the year (January-Jun
- Page 141 and 142: its second wettest such period. Sev
- Page 143 and 144: California began the year with mode
- Page 145 and 146: The first drought occurred in March
- Page 147 and 148: Fig. 7.8. (a) Annual mean temperatu
- Page 149: Fig. 7.11. (a) Annual mean temperat
- Page 153 and 154: Fig. 7.14. Composite for standardiz
- Page 155 and 156: Fig. 7.17. Daily maximum temperatur
- Page 157 and 158: (ii) PrecipitationDecember to Febru
- Page 159 and 160: For Zimbabwe, the rainfall season,
- Page 161 and 162: Fig. 7.28. Annual mean temperature
- Page 163 and 164: Fig. 7.31. Seasonal anomalies (1961
- Page 165 and 166: (1706-2009), and new national recor
- Page 167 and 168: cold in southern and central Finlan
- Page 169 and 170: EXCEPTIONAL storm strikes northern
- Page 171 and 172: 7.32b). April was particularly mild
- Page 173 and 174: to -44 о С) persisted in southern
- Page 175 and 176: Fig. 7.39. Weather conditions in De
- Page 177 and 178: on the 1971-2000 climatology) for a
- Page 179 and 180: excess rainfall, while 11 subdivisi
- Page 181 and 182: 4) Southwest Asia(i) Iraq—M. Roge
- Page 183 and 184: Wales. The warmth was particularly
- Page 185 and 186: The most significant severe thunder
- Page 187 and 188: mm thick, which fell on parts of No
- Page 189 and 190: and Vanua Levu islands (Fiji) as a
- Page 191 and 192: Table 7.5. Maximum temperature anom
- Page 193 and 194: 8. SEASONAL SUMMARIES—Mike Halper
- Page 195 and 196: Fig. 8.5. Jun-Aug 2009 (top) surfac
- Page 197 and 198: ACKNOWLEDGMENTSIn addition to the m
- Page 199 and 200: CFCCFC-11CFC-12CH 4Chl satCIIFENClC
- Page 201 and 202:
OAFlux Objectively Analyzed Air-Sea
- Page 203 and 204:
Ashok, K., S. K. Behera, S. A. Rao,
- Page 205 and 206:
Cangialosi, J. P., and L. A. Avila,
- Page 207 and 208:
Francis, J. A., W. Chan, D. J. Leat
- Page 209 and 210:
Hudson, J. M. G., and G. H. R. Henr
- Page 211 and 212:
Landsea, C. W., and W. M. Gray, 199
- Page 213 and 214:
Meinen, C. S., M. O. Baringer, and
- Page 215 and 216:
Ramaswamy, V., M. D. Schwarzkopf, W
- Page 217 and 218:
——, ——, T. C. Peterson, and
- Page 219 and 220:
Wang, L., C. Derksen, and R. Brown,
- Page 224:
Monthly average temperature anomali