- Page 8 and 9:
Luo, Jing-Jia, Research Institute f
- Page 10 and 11:
Tedesco, Marco, Department Earth an
- Page 12 and 13:
4. THE TROPICS.....................
- Page 14 and 15:
ABSTRACT—M. O. Baringer, D. S. Ar
- Page 16 and 17:
I. INTRODUCTION—M. O. Baringer an
- Page 18 and 19:
Table 1.1 The GCOS Essential Climat
- Page 20 and 21:
S18 | juNE 2010
- Page 22 and 23:
Stratospheric TemperatureCloudiness
- Page 25:
Source Datasets Sectionhttp://www.p
- Page 28 and 29:
HOW do WE KNOW THE WORLD HAS WARMED
- Page 30 and 31:
Fig. 2.6. As for Fig. 2.1 but for l
- Page 32 and 33:
Fig. 2.10. Change in TCWV from 2008
- Page 34 and 35:
Precipitation anomalies in 2009, ov
- Page 36 and 37:
Fig. 2.18. Seasonal SCE anomalies (
- Page 38 and 39:
USING SI-TRACABLE GLOBAL POSITIONIN
- Page 40 and 41:
6) Lake levels—C. BirkettLake vol
- Page 42 and 43:
Fig. 2.30. (a) The daily AO index f
- Page 45 and 46:
(C) Carbon monoxide (CO)There has b
- Page 47 and 48:
Table 2.5. Mixing ratios, radiative
- Page 50 and 51:
the mid-1990s but has since levelle
- Page 52 and 53:
with all 42 glaciers observed retre
- Page 54 and 55:
of 0.1° and 5 days (Kaiser et al.
- Page 56 and 57:
Fig. 3.1. (a) Yearly mean SSTAs in
- Page 58 and 59:
(Fig. 3.3c). It is interesting that
- Page 60 and 61:
strong there, consistent with anoma
- Page 62 and 63:
cont'RECENT ADVANCES IN OUR UNDERST
- Page 64 and 65:
is to cause SST to rise if oceanic
- Page 66 and 67:
egions around the subtropical salin
- Page 68 and 69:
Fig 3.17. Principal empirical ortho
- Page 70 and 71:
Fig. 3.19. Daily estimates of the s
- Page 72 and 73:
Fig. 3.22. (top) The 2009 SSH anoma
- Page 74 and 75:
to update the CO 2climatology, ther
- Page 76 and 77:
µmol kg -1 or about half of the ac
- Page 78 and 79:
Fig. 3.31. (a) Average MODIS-Aqua C
- Page 80 and 81:
latitudes, chlorophyll and thermal
- Page 83 and 84:
Fig. 4.4. (a) Anomalous 850-hPa win
- Page 85 and 86:
(Fig. 4.6). These include four MJO
- Page 87 and 88:
Fig. 4.8. NOAA’s ACE index expres
- Page 89 and 90:
Fig. 4.14. ASO 2009: Anomalous 200-
- Page 91 and 92:
Fig. 4.17. The tracks of all TCs th
- Page 93 and 94:
Several previous studies have shown
- Page 95 and 96:
followed by TY Linfa and TS Nangka
- Page 97 and 98:
The Philippines were severely affec
- Page 99 and 100:
The historical SIO TC data is proba
- Page 101 and 102:
Fig. 4.26. Global anomalies of TCHP
- Page 103 and 104:
degree resolution NASA TRMM rainfal
- Page 105 and 106:
F i g. 4.32 . TRMM (a) mean and (b)
- Page 107 and 108:
THE forgotten sub-BASIN—THE centr
- Page 109 and 110:
5. THE ARCTIC—J. Richter-Menge, E
- Page 111 and 112:
and North America (south of 55° la
- Page 113 and 114:
Fig. 5.8. 2007-09 Atlantic water la
- Page 115 and 116:
d. Sea ice cover—D. Perovich, R.
- Page 117 and 118:
e. Land1) Vegetation—D. A. Walker
- Page 119 and 120:
Fig. 5.18. Total annual river disch
- Page 121 and 122:
negative SCD anomalies were evident
- Page 123 and 124:
with records beginning in 1873, the
- Page 125 and 126:
(QuikSCAT, 2000-09) microwave remot
- Page 127 and 128:
6. ANTARCTICAa. Overview—R. L. Fo
- Page 129 and 130:
(SCAR) report ‘Antarctic Climate
- Page 131 and 132:
these stations in April, August, an
- Page 133 and 134:
e. 2008-2009 Seasonal melt extent a
- Page 135 and 136:
positive ice-season duration anomal
- Page 137 and 138:
7. REGIONAL CLIMATESa. Introduction
- Page 139 and 140:
first half of the year (January-Jun
- Page 141 and 142:
its second wettest such period. Sev
- Page 143 and 144: California began the year with mode
- Page 145 and 146: The first drought occurred in March
- Page 147 and 148: Fig. 7.8. (a) Annual mean temperatu
- Page 149 and 150: Fig. 7.11. (a) Annual mean temperat
- Page 151 and 152: EXTREME rainfall and the flood of t
- Page 153 and 154: Fig. 7.14. Composite for standardiz
- Page 155 and 156: Fig. 7.17. Daily maximum temperatur
- Page 157 and 158: (ii) PrecipitationDecember to Febru
- Page 159 and 160: For Zimbabwe, the rainfall season,
- Page 161 and 162: Fig. 7.28. Annual mean temperature
- Page 163 and 164: Fig. 7.31. Seasonal anomalies (1961
- Page 165 and 166: (1706-2009), and new national recor
- Page 167 and 168: cold in southern and central Finlan
- Page 169 and 170: EXCEPTIONAL storm strikes northern
- Page 171 and 172: 7.32b). April was particularly mild
- Page 173 and 174: to -44 о С) persisted in southern
- Page 175 and 176: Fig. 7.39. Weather conditions in De
- Page 177 and 178: on the 1971-2000 climatology) for a
- Page 179 and 180: excess rainfall, while 11 subdivisi
- Page 181 and 182: 4) Southwest Asia(i) Iraq—M. Roge
- Page 183 and 184: Wales. The warmth was particularly
- Page 185 and 186: The most significant severe thunder
- Page 187 and 188: mm thick, which fell on parts of No
- Page 189 and 190: and Vanua Levu islands (Fiji) as a
- Page 191 and 192: Table 7.5. Maximum temperature anom
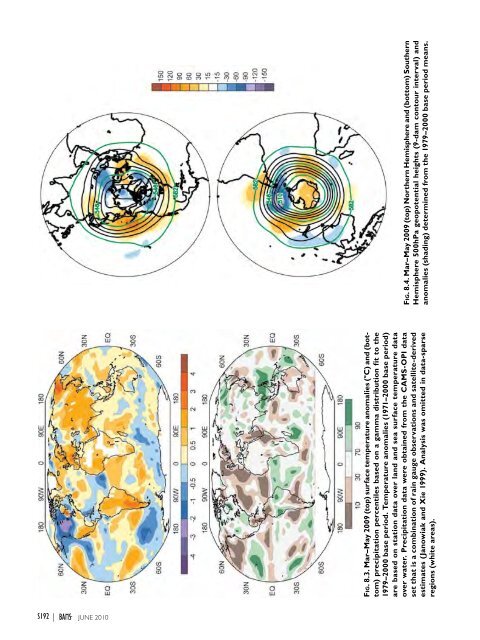
- Page 193: 8. SEASONAL SUMMARIES—Mike Halper
- Page 197 and 198: ACKNOWLEDGMENTSIn addition to the m
- Page 199 and 200: CFCCFC-11CFC-12CH 4Chl satCIIFENClC
- Page 201 and 202: OAFlux Objectively Analyzed Air-Sea
- Page 203 and 204: Ashok, K., S. K. Behera, S. A. Rao,
- Page 205 and 206: Cangialosi, J. P., and L. A. Avila,
- Page 207 and 208: Francis, J. A., W. Chan, D. J. Leat
- Page 209 and 210: Hudson, J. M. G., and G. H. R. Henr
- Page 211 and 212: Landsea, C. W., and W. M. Gray, 199
- Page 213 and 214: Meinen, C. S., M. O. Baringer, and
- Page 215 and 216: Ramaswamy, V., M. D. Schwarzkopf, W
- Page 217 and 218: ——, ——, T. C. Peterson, and
- Page 219 and 220: Wang, L., C. Derksen, and R. Brown,
- Page 224: Monthly average temperature anomali