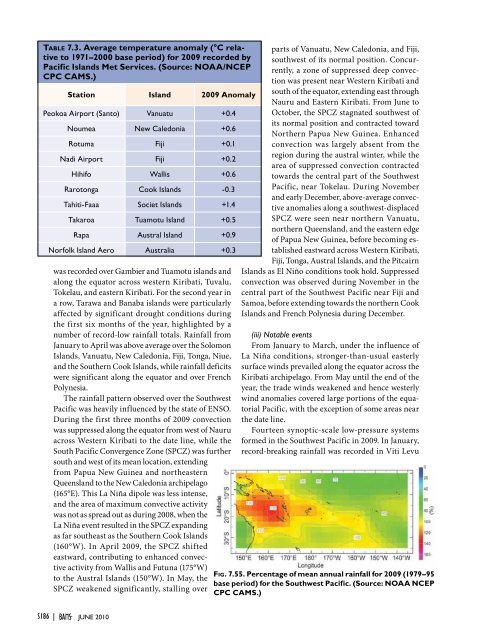
Table 7.3. Average temperature anomaly (°C relativeto 1971–2000 base period) for <strong>2009</strong> recorded byPacific Islands Met Services. (Source: NOAA/NCEPCPC CAMS.)Station Island <strong>2009</strong> AnomalyPeokoa Airport (Santo) Vanuatu +0.4Noumea New Caledonia +0.6Rotuma Fiji +0.1Nadi Airport Fiji +0.2Hihifo Wallis +0.6Rarotonga Cook Islands -0.3Tahiti-Faaa Societ Islands +1.4Takaroa Tuamotu Island +0.5Rapa Austral Island +0.9Norfolk Island Aero Australia +0.3was recorded over Gambier and Tuamotu islands andalong the equator across western Kiribati, Tuvalu,Tokelau, and eastern Kiribati. For the second year ina row, Tarawa and Banaba islands were particularlyaffected by significant drought conditions duringthe first six months of the year, highlighted by anumber of record-low rainfall totals. Rainfall fromJanuary to April was above average over the SolomonIslands, Vanuatu, New Caledonia, Fiji, Tonga, Niue,and the Southern Cook Islands, while rainfall deficitswere significant along the equator and over FrenchPolynesia.The rainfall pattern observed over the SouthwestPacific was heavily influenced by the state of ENSO.During the first three months of <strong>2009</strong> convectionwas suppressed along the equator from west of Nauruacross Western Kiribati to the date line, while theSouth Pacific Convergence Zone (SPCZ) was furthersouth and west of its mean location, extendingfrom Papua New Guinea and northeasternQueensland to the New Caledonia archipelago(165°E). This La Niña dipole was less intense,and the area of maximum convective activitywas not as spread out as during 2008, when theLa Niña event resulted in the SPCZ expandingas far southeast as the Southern Cook Islands(160°W). In April <strong>2009</strong>, the SPCZ shiftedeastward, contributing to enhanced convectiveactivity from Wallis and Futuna (175°W)to the Austral Islands (150°W). In May, theSPCZ weakened significantly, stalling overparts of Vanuatu, New Caledonia, and Fiji,southwest of its normal position. Concurrently,a zone of suppressed deep convectionwas present near Western Kiribati andsouth of the equator, extending east throughNauru and Eastern Kiribati. From June toOctober, the SPCZ stagnated southwest ofits normal position and contracted towardNorthern Papua New Guinea. Enhancedconvection was largely absent from theregion during the austral winter, while thearea of suppressed convection contractedtowards the central part of the SouthwestPacific, near Tokelau. During Novemberand early December, above-average convectiveanomalies along a southwest-displacedSPCZ were seen near northern Vanuatu,northern Queensland, and the eastern edgeof Papua New Guinea, before becoming establishedeastward across Western Kiribati,Fiji, Tonga, Austral Islands, and the PitcairnIslands as El Niño conditions took hold. Suppressedconvection was observed during November in thecentral part of the Southwest Pacific near Fiji andSamoa, before extending towards the northern CookIslands and French Polynesia during December.(iii) Notable eventsFrom January to March, under the influence ofLa Niña conditions, stronger-than-usual easterlysurface winds prevailed along the equator across theKiribati archipelago. From May until the end of theyear, the trade winds weakened and hence westerlywind anomalies covered large portions of the equatorialPacific, with the exception of some areas nearthe date line.Fourteen synoptic-scale low-pressure systemsformed in the Southwest Pacific in <strong>2009</strong>. In January,record-breaking rainfall was recorded in Viti LevuFig. 7.55. Percentage of mean annual rainfall for <strong>2009</strong> (1979–95base period) for the Southwest Pacific. (Source: NOAA NCEPCPC CAMS.)S186 | juNE 2010
and Vanua Levu islands (Fiji) as a consequence ofa hovering monsoonal trough, an enhanced SouthPacific Convergence Zone (SPCZ), two tropical depressions,and Tropical Cyclone Hettie. A total of 14stations recorded at least 700 mm of rainfall duringJanuary, seven of them collecting more than 1000mm. Overall, 75% of rain gauges in the Western,Central, and Eastern Divisions of Fiji recorded 200%of their average January rainfall. The related floodingis considered to be the country’s worst in over75 years, claiming 12 lives and causing substantialdamages to agricultural crops, road, electricity, andwater infrastructure.In December, category 2 Tropical Cyclone Micklashed the islands of Yasawa and Viti Levu, Fiji.On 14 December, sustained wind speeds of up to81.3 km hr -1 and guststhat reached 107.2 kmhr -1 were recordedat Nausori Airportnear Suva. Five deathsand severe damage tocrops and livestockwere reported.Typical of La Niñaconditions, positivesea surface temperatureanomalies werepresent around Vanuatu,New Caledonia,west and south of Fiji,and southern FrenchPolynesia early in theyear. From April toJune, SSTs cooled inthe Southwest Pacific,while positive anomaliesdeveloped in thewestern equatorialPacific after May. InOctober, the warmanomalies in the westernPacific dissipatedand warm anomaliesdeveloped south ofFrench Polynesia. InDecember, a large areaof positive anomalies,with the central regionexceeding +3°C,existed from 160°W–90°W and 30°S–65°S.Positive sea level anomalies existed in the SouthwestPacific in January from Papua New Guineasoutheast to the Southern Cook Islands. Anomaliesjust east of Papua New Guinea exceeded +25 cm, whilemonthly mean sea levels at Fiji and Tonga were thehighest on record. Monthly mean sea level at Fiji forFebruary was, for a second month in a row, the higheston record. Tropical Cyclone Lin brought elevated sealevels to Tonga on 4 April <strong>2009</strong>. Sea level at the heightof the storm was 0.5 m higher than the predicted tide.Positive anomalies developed in the Southwest Pacificin May and extended almost to Rapa Island. In June,positive anomalies in the Southwest Pacific contractedboth in area and magnitude but then expanded in Julyin the Southwest Pacific to the Southern Cook Islands.By September, the area with positive anomalies inTable 7.4. Annual rainfall for <strong>2009</strong> reported by Pacific Islands MetServicesStationIsland<strong>2009</strong>RainfallAnnual Mean(1979–95)Percentof MeanPeokoa Airport(Santo)Vanuatu 3003 2452 122%Koumac New Caledonia 1529 995 415%Noumea New Caledonia 1129 1074 105%Tarawa Kiribati 2272 2302 99%Rotuma Fiji 3851 3515 110%Nabouwalu Fiji 3676 2130 173%Nadi Airport Fiji 2799 1708 164%Vunisea Fiji 2358 2047 115%Hihifo Wallis 2819 3218 88%Maopopo Futuna 4861 3206 152%Apia Samoa 2331 2770 84%Papo Pago American Samoa 3479 3003 116%Rarotonga Cook Islands 1657 1829 91%Atuona Marquesas Islands 1356 1677 81%Tahiti-Faaa society islands 1396 1690 83%Takaroa Tuamotu Island 1129 1592 71%Rikitea Gambier Islands 1728 1994 87%Tubuia Austral Islands 1777 1843 96%Rapa Austral Island 2865 2560 112%Lord Howe IslandAeroAustral 1194 1483 81%Norfolk Island Aero Australia 901 1302 69%<strong>STATE</strong> <strong>OF</strong> <strong>THE</strong> <strong>CLIMATE</strong> <strong>IN</strong> <strong>2009</strong> juNE 2010 |S187
- Page 8 and 9:
Luo, Jing-Jia, Research Institute f
- Page 10 and 11:
Tedesco, Marco, Department Earth an
- Page 12 and 13:
4. THE TROPICS.....................
- Page 14 and 15:
ABSTRACT—M. O. Baringer, D. S. Ar
- Page 16 and 17:
I. INTRODUCTION—M. O. Baringer an
- Page 18 and 19:
Table 1.1 The GCOS Essential Climat
- Page 20 and 21:
S18 | juNE 2010
- Page 22 and 23:
Stratospheric TemperatureCloudiness
- Page 25:
Source Datasets Sectionhttp://www.p
- Page 28 and 29:
HOW do WE KNOW THE WORLD HAS WARMED
- Page 30 and 31:
Fig. 2.6. As for Fig. 2.1 but for l
- Page 32 and 33:
Fig. 2.10. Change in TCWV from 2008
- Page 34 and 35:
Precipitation anomalies in 2009, ov
- Page 36 and 37:
Fig. 2.18. Seasonal SCE anomalies (
- Page 38 and 39:
USING SI-TRACABLE GLOBAL POSITIONIN
- Page 40 and 41:
6) Lake levels—C. BirkettLake vol
- Page 42 and 43:
Fig. 2.30. (a) The daily AO index f
- Page 45 and 46:
(C) Carbon monoxide (CO)There has b
- Page 47 and 48:
Table 2.5. Mixing ratios, radiative
- Page 50 and 51:
the mid-1990s but has since levelle
- Page 52 and 53:
with all 42 glaciers observed retre
- Page 54 and 55:
of 0.1° and 5 days (Kaiser et al.
- Page 56 and 57:
Fig. 3.1. (a) Yearly mean SSTAs in
- Page 58 and 59:
(Fig. 3.3c). It is interesting that
- Page 60 and 61:
strong there, consistent with anoma
- Page 62 and 63:
cont'RECENT ADVANCES IN OUR UNDERST
- Page 64 and 65:
is to cause SST to rise if oceanic
- Page 66 and 67:
egions around the subtropical salin
- Page 68 and 69:
Fig 3.17. Principal empirical ortho
- Page 70 and 71:
Fig. 3.19. Daily estimates of the s
- Page 72 and 73:
Fig. 3.22. (top) The 2009 SSH anoma
- Page 74 and 75:
to update the CO 2climatology, ther
- Page 76 and 77:
µmol kg -1 or about half of the ac
- Page 78 and 79:
Fig. 3.31. (a) Average MODIS-Aqua C
- Page 80 and 81:
latitudes, chlorophyll and thermal
- Page 83 and 84:
Fig. 4.4. (a) Anomalous 850-hPa win
- Page 85 and 86:
(Fig. 4.6). These include four MJO
- Page 87 and 88:
Fig. 4.8. NOAA’s ACE index expres
- Page 89 and 90:
Fig. 4.14. ASO 2009: Anomalous 200-
- Page 91 and 92:
Fig. 4.17. The tracks of all TCs th
- Page 93 and 94:
Several previous studies have shown
- Page 95 and 96:
followed by TY Linfa and TS Nangka
- Page 97 and 98:
The Philippines were severely affec
- Page 99 and 100:
The historical SIO TC data is proba
- Page 101 and 102:
Fig. 4.26. Global anomalies of TCHP
- Page 103 and 104:
degree resolution NASA TRMM rainfal
- Page 105 and 106:
F i g. 4.32 . TRMM (a) mean and (b)
- Page 107 and 108:
THE forgotten sub-BASIN—THE centr
- Page 109 and 110:
5. THE ARCTIC—J. Richter-Menge, E
- Page 111 and 112:
and North America (south of 55° la
- Page 113 and 114:
Fig. 5.8. 2007-09 Atlantic water la
- Page 115 and 116:
d. Sea ice cover—D. Perovich, R.
- Page 117 and 118:
e. Land1) Vegetation—D. A. Walker
- Page 119 and 120:
Fig. 5.18. Total annual river disch
- Page 121 and 122:
negative SCD anomalies were evident
- Page 123 and 124:
with records beginning in 1873, the
- Page 125 and 126:
(QuikSCAT, 2000-09) microwave remot
- Page 127 and 128:
6. ANTARCTICAa. Overview—R. L. Fo
- Page 129 and 130:
(SCAR) report ‘Antarctic Climate
- Page 131 and 132:
these stations in April, August, an
- Page 133 and 134:
e. 2008-2009 Seasonal melt extent a
- Page 135 and 136:
positive ice-season duration anomal
- Page 137 and 138: 7. REGIONAL CLIMATESa. Introduction
- Page 139 and 140: first half of the year (January-Jun
- Page 141 and 142: its second wettest such period. Sev
- Page 143 and 144: California began the year with mode
- Page 145 and 146: The first drought occurred in March
- Page 147 and 148: Fig. 7.8. (a) Annual mean temperatu
- Page 149 and 150: Fig. 7.11. (a) Annual mean temperat
- Page 151 and 152: EXTREME rainfall and the flood of t
- Page 153 and 154: Fig. 7.14. Composite for standardiz
- Page 155 and 156: Fig. 7.17. Daily maximum temperatur
- Page 157 and 158: (ii) PrecipitationDecember to Febru
- Page 159 and 160: For Zimbabwe, the rainfall season,
- Page 161 and 162: Fig. 7.28. Annual mean temperature
- Page 163 and 164: Fig. 7.31. Seasonal anomalies (1961
- Page 165 and 166: (1706-2009), and new national recor
- Page 167 and 168: cold in southern and central Finlan
- Page 169 and 170: EXCEPTIONAL storm strikes northern
- Page 171 and 172: 7.32b). April was particularly mild
- Page 173 and 174: to -44 о С) persisted in southern
- Page 175 and 176: Fig. 7.39. Weather conditions in De
- Page 177 and 178: on the 1971-2000 climatology) for a
- Page 179 and 180: excess rainfall, while 11 subdivisi
- Page 181 and 182: 4) Southwest Asia(i) Iraq—M. Roge
- Page 183 and 184: Wales. The warmth was particularly
- Page 185 and 186: The most significant severe thunder
- Page 187: mm thick, which fell on parts of No
- Page 191 and 192: Table 7.5. Maximum temperature anom
- Page 193 and 194: 8. SEASONAL SUMMARIES—Mike Halper
- Page 195 and 196: Fig. 8.5. Jun-Aug 2009 (top) surfac
- Page 197 and 198: ACKNOWLEDGMENTSIn addition to the m
- Page 199 and 200: CFCCFC-11CFC-12CH 4Chl satCIIFENClC
- Page 201 and 202: OAFlux Objectively Analyzed Air-Sea
- Page 203 and 204: Ashok, K., S. K. Behera, S. A. Rao,
- Page 205 and 206: Cangialosi, J. P., and L. A. Avila,
- Page 207 and 208: Francis, J. A., W. Chan, D. J. Leat
- Page 209 and 210: Hudson, J. M. G., and G. H. R. Henr
- Page 211 and 212: Landsea, C. W., and W. M. Gray, 199
- Page 213 and 214: Meinen, C. S., M. O. Baringer, and
- Page 215 and 216: Ramaswamy, V., M. D. Schwarzkopf, W
- Page 217 and 218: ——, ——, T. C. Peterson, and
- Page 219 and 220: Wang, L., C. Derksen, and R. Brown,
- Page 224: Monthly average temperature anomali