


Create successful ePaper yourself
Turn your PDF publications into a flip-book with our unique Google optimized e-Paper software.
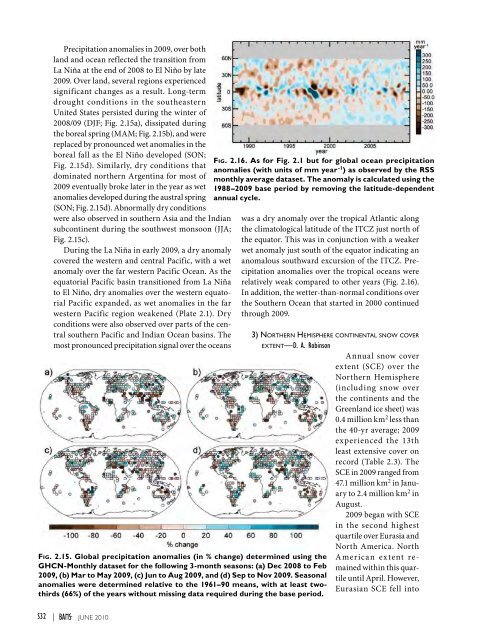
Precipitation anomalies in <strong>2009</strong>, over bothland and ocean reflected the transition fromLa Niña at the end of 2008 to El Niño by late<strong>2009</strong>. Over land, several regions experiencedsignificant changes as a result. Long-termdrought conditions in the southeasternUnited States persisted during the winter of2008/09 (DJF; Fig. 2.15a), dissipated duringthe boreal spring (MAM; Fig. 2.15b), and werereplaced by pronounced wet anomalies in theboreal fall as the El Niño developed (SON;Fig. 2.15d). Similarly, dry conditions thatdominated northern Argentina for most of<strong>2009</strong> eventually broke later in the year as wetanomalies developed during the austral spring(SON; Fig. 2.15d). Abnormally dry conditionswere also observed in southern Asia and the Indiansubcontinent during the southwest monsoon (JJA;Fig. 2.15c).During the La Niña in early <strong>2009</strong>, a dry anomalycovered the western and central Pacific, with a wetanomaly over the far western Pacific Ocean. As theequatorial Pacific basin transitioned from La Niñato El Niño, dry anomalies over the western equatorialPacific expanded, as wet anomalies in the farwestern Pacific region weakened (Plate 2.1). Dryconditions were also observed over parts of the centralsouthern Pacific and Indian Ocean basins. Themost pronounced precipitation signal over the oceansFig. 2.16. As for Fig. 2.1 but for global ocean precipitationanomalies (with units of mm year -1 ) as observed by the RSSmonthly average dataset. The anomaly is calculated using the1988–<strong>2009</strong> base period by removing the latitude-dependentannual cycle.Fig. 2.15. Global precipitation anomalies (in % change) determined using theGHCN-Monthly dataset for the following 3-month seasons: (a) Dec 2008 to Feb<strong>2009</strong>, (b) Mar to May <strong>2009</strong>, (c) Jun to Aug <strong>2009</strong>, and (d) Sep to Nov <strong>2009</strong>. Seasonalanomalies were determined relative to the 1961–90 means, with at least twothirds(66%) of the years without missing data required during the base period.was a dry anomaly over the tropical Atlantic alongthe climatological latitude of the ITCZ just north ofthe equator. This was in conjunction with a weakerwet anomaly just south of the equator indicating ananomalous southward excursion of the ITCZ. Precipitationanomalies over the tropical oceans wererelatively weak compared to other years (Fig. 2.16).In addition, the wetter-than-normal conditions overthe Southern Ocean that started in 2000 continuedthrough <strong>2009</strong>.3) Northern Hemisphere continental snow coverextent—D. A. RobinsonAnnual snow coverextent (SCE) over theNorthern Hemisphere(including snow overthe continents and theGreenland ice sheet) was0.4 million km 2 less thanthe 40-yr average; <strong>2009</strong>experienced the 13thleast extensive cover onrecord (Table 2.3). TheSCE in <strong>2009</strong> ranged from47.1 million km 2 in Januaryto 2.4 million km 2 inAugust.<strong>2009</strong> began with SCEin the second highestquartile over Eurasia andNorth America. NorthAmerican extent remainedwithin this quartileuntil April. However,Eurasian SCE fell intoS32 | juNE 2010


