


You also want an ePaper? Increase the reach of your titles
YUMPU automatically turns print PDFs into web optimized ePapers that Google loves.
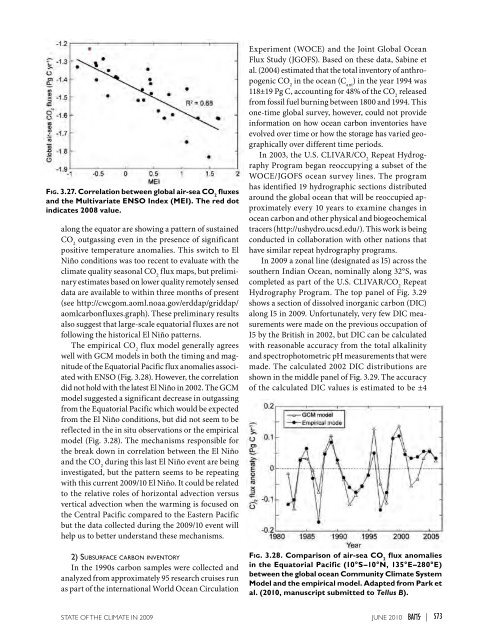
Fig. 3.27. Correlation between global air-sea CO 2fluxesand the Multivariate ENSO Index (MEI). The red dotindicates 2008 value.along the equator are showing a pattern of sustainedCO 2outgassing even in the presence of significantpositive temperature anomalies. This switch to ElNiño conditions was too recent to evaluate with theclimate quality seasonal CO 2flux maps, but preliminaryestimates based on lower quality remotely senseddata are available to within three months of present(see http://cwcgom.aoml.noaa.gov/erddap/griddap/aomlcarbonfluxes.graph). These preliminary resultsalso suggest that large-scale equatorial fluxes are notfollowing the historical El Niño patterns.The empirical CO 2flux model generally agreeswell with GCM models in both the timing and magnitudeof the Equatorial Pacific flux anomalies associatedwith ENSO (Fig. 3.28). However, the correlationdid not hold with the latest El Niño in 2002. The GCMmodel suggested a significant decrease in outgassingfrom the Equatorial Pacific which would be expectedfrom the El Niño conditions, but did not seem to bereflected in the in situ observations or the empiricalmodel (Fig. 3.28). The mechanisms responsible forthe break down in correlation between the El Niñoand the CO 2during this last El Niño event are beinginvestigated, but the pattern seems to be repeatingwith this current <strong>2009</strong>/10 El Niño. It could be relatedto the relative roles of horizontal advection versusvertical advection when the warming is focused onthe Central Pacific compared to the Eastern Pacificbut the data collected during the <strong>2009</strong>/10 event willhelp us to better understand these mechanisms.2) Subsurface carbon inventoryIn the 1990s carbon samples were collected andanalyzed from approximately 95 research cruises runas part of the international World Ocean CirculationExperiment (WOCE) and the Joint Global OceanFlux Study (JG<strong>OF</strong>S). Based on these data, Sabine etal. (2004) estimated that the total inventory of anthropogenicCO 2in the ocean (C ant) in the year 1994 was118±19 Pg C, accounting for 48% of the CO 2releasedfrom fossil fuel burning between 1800 and 1994. Thisone-time global survey, however, could not provideinformation on how ocean carbon inventories haveevolved over time or how the storage has varied geographicallyover different time periods.In 2003, the U.S. CLIVAR/CO 2Repeat HydrographyProgram began reoccupying a subset of theWOCE/JG<strong>OF</strong>S ocean survey lines. The programhas identified 19 hydrographic sections distributedaround the global ocean that will be reoccupied approximatelyevery 10 years to examine changes inocean carbon and other physical and biogeochemicaltracers (http://ushydro.ucsd.edu/). This work is beingconducted in collaboration with other nations thathave similar repeat hydrography programs.In <strong>2009</strong> a zonal line (designated as I5) across thesouthern Indian Ocean, nominally along 32°S, wascompleted as part of the U.S. CLIVAR/CO 2RepeatHydrography Program. The top panel of Fig. 3.29shows a section of dissolved inorganic carbon (DIC)along I5 in <strong>2009</strong>. Unfortunately, very few DIC measurementswere made on the previous occupation ofI5 by the British in 2002, but DIC can be calculatedwith reasonable accuracy from the total alkalinityand spectrophotometric pH measurements that weremade. The calculated 2002 DIC distributions areshown in the middle panel of Fig. 3.29. The accuracyof the calculated DIC values is estimated to be ±4Fig. 3.28. Comparison of air-sea CO 2flux anomaliesin the Equatorial Pacific (10°S–10°N, 135°E–280°E)between the global ocean Community Climate SystemModel and the empirical model. Adapted from Park etal. (2010, manuscript submitted to Tellus B).<strong>STATE</strong> <strong>OF</strong> <strong>THE</strong> <strong>CLIMATE</strong> <strong>IN</strong> <strong>2009</strong> juNE 2010 |S73


