


You also want an ePaper? Increase the reach of your titles
YUMPU automatically turns print PDFs into web optimized ePapers that Google loves.
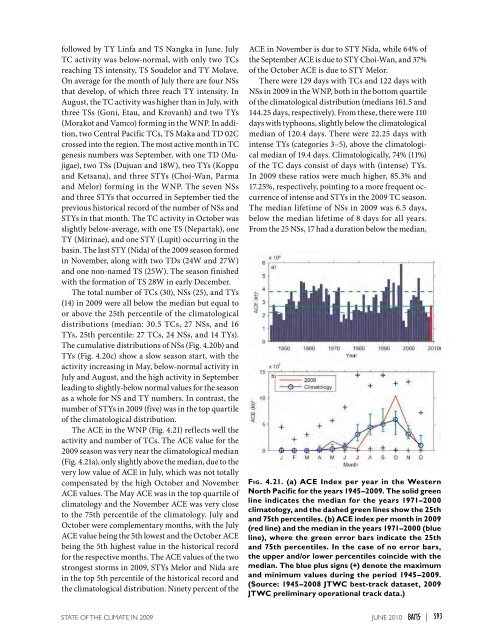
followed by TY Linfa and TS Nangka in June. JulyTC activity was below-normal, with only two TCsreaching TS intensity, TS Soudelor and TY Molave.On average for the month of July there are four NSsthat develop, of which three reach TY intensity. InAugust, the TC activity was higher than in July, withthree TSs (Goni, Etau, and Krovanh) and two TYs(Morakot and Vamco) forming in the WNP. In addition,two Central Pacific TCs, TS Maka and TD 02Ccrossed into the region. The most active month in TCgenesis numbers was September, with one TD (Mujigae),two TSs (Dujuan and 18W), two TYs (Koppuand Ketsana), and three STYs (Choi-Wan, Parmaand Melor) forming in the WNP. The seven NSsand three STYs that occurred in September tied theprevious historical record of the number of NSs andSTYs in that month. The TC activity in October wasslightly below-average, with one TS (Nepartak), oneTY (Mirinae), and one STY (Lupit) occurring in thebasin. The last STY (Nida) of the <strong>2009</strong> season formedin November, along with two TDs (24W and 27W)and one non-named TS (25W). The season finishedwith the formation of TS 28W in early December.The total number of TCs (30), NSs (25), and TYs(14) in <strong>2009</strong> were all below the median but equal toor above the 25th percentile of the climatologicaldistributions (median: 30.5 TCs, 27 NSs, and 16TYs, 25th percentile: 27 TCs, 24 NSs, and 14 TYs).The cumulative distributions of NSs (Fig. 4.20b) andTYs (Fig. 4.20c) show a slow season start, with theactivity increasing in May, below-normal activity inJuly and August, and the high activity in Septemberleading to slightly-below normal values for the seasonas a whole for NS and TY numbers. In contrast, thenumber of STYs in <strong>2009</strong> (five) was in the top quartileof the climatological distribution.The ACE in the WNP (Fig. 4.21) reflects well theactivity and number of TCs. The ACE value for the<strong>2009</strong> season was very near the climatological median(Fig. 4.21a), only slightly above the median, due to thevery low value of ACE in July, which was not totallycompensated by the high October and NovemberACE values. The May ACE was in the top quartile ofclimatology and the November ACE was very closeto the 75th percentile of the climatology. July andOctober were complementary months, with the JulyACE value being the 5th lowest and the October ACEbeing the 5th highest value in the historical recordfor the respective months. The ACE values of the twostrongest storms in <strong>2009</strong>, STYs Melor and Nida arein the top 5th percentile of the historical record andthe climatological distribution. Ninety percent of theACE in November is due to STY Nida, while 64% ofthe September ACE is due to STY Choi-Wan, and 37%of the October ACE is due to STY Melor.There were 129 days with TCs and 122 days withNSs in <strong>2009</strong> in the WNP, both in the bottom quartileof the climatological distribution (medians 161.5 and144.25 days, respectively). From these, there were 110days with typhoons, slightly below the climatologicalmedian of 120.4 days. There were 22.25 days withintense TYs (categories 3–5), above the climatologicalmedian of 19.4 days. Climatologically, 74% (11%)of the TC days consist of days with (intense) TYs.In <strong>2009</strong> these ratios were much higher, 85.3% and17.25%, respectively, pointing to a more frequent occurrenceof intense and STYs in the <strong>2009</strong> TC season.The median lifetime of NSs in <strong>2009</strong> was 6.5 days,below the median lifetime of 8 days for all years.From the 25 NSs, 17 had a duration below the median,Fig. 4.21. (a) ACE Index per year in the WesternNorth Pacific for the years 1945–<strong>2009</strong>. The solid greenline indicates the median for the years 1971–2000climatology, and the dashed green lines show the 25thand 75th percentiles. (b) ACE index per month in <strong>2009</strong>(red line) and the median in the years 1971–2000 (blueline), where the green error bars indicate the 25thand 75th percentiles. In the case of no error bars,the upper and/or lower percentiles coincide with themedian. The blue plus signs (+) denote the maximumand minimum values during the period 1945–<strong>2009</strong>.(Source: 1945–2008 JTWC best-track dataset, <strong>2009</strong>JTWC preliminary operational track data.)<strong>STATE</strong> <strong>OF</strong> <strong>THE</strong> <strong>CLIMATE</strong> <strong>IN</strong> <strong>2009</strong> juNE 2010 |S93


