


You also want an ePaper? Increase the reach of your titles
YUMPU automatically turns print PDFs into web optimized ePapers that Google loves.
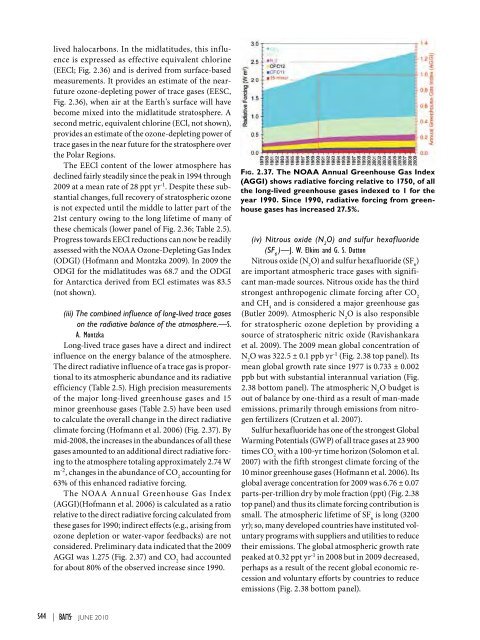
lived halocarbons. In the midlatitudes, this influenceis expressed as effective equivalent chlorine(EECl; Fig. 2.36) and is derived from surface-basedmeasurements. It provides an estimate of the nearfutureozone-depleting power of trace gases (EESC,Fig. 2.36), when air at the Earth’s surface will havebecome mixed into the midlatitude stratosphere. Asecond metric, equivalent chlorine (ECl, not shown),provides an estimate of the ozone-depleting power oftrace gases in the near future for the stratosphere overthe Polar Regions.The EECl content of the lower atmosphere hasdeclined fairly steadily since the peak in 1994 through<strong>2009</strong> at a mean rate of 28 ppt yr -1 . Despite these substantialchanges, full recovery of stratospheric ozoneis not expected until the middle to latter part of the21st century owing to the long lifetime of many ofthese chemicals (lower panel of Fig. 2.36; Table 2.5).Progress towards EECl reductions can now be readilyassessed with the NOAA Ozone-Depleting Gas Index(ODGI) (Hofmann and Montzka <strong>2009</strong>). In <strong>2009</strong> theODGI for the midlatitudes was 68.7 and the ODGIfor Antarctica derived from ECl estimates was 83.5(not shown).(iii) The combined influence of long-lived trace gaseson the radiative balance of the atmosphere.—S.A. MontzkaLong-lived trace gases have a direct and indirectinfluence on the energy balance of the atmosphere.The direct radiative influence of a trace gas is proportionalto its atmospheric abundance and its radiativeefficiency (Table 2.5). High precision measurementsof the major long-lived greenhouse gases and 15minor greenhouse gases (Table 2.5) have been usedto calculate the overall change in the direct radiativeclimate forcing (Hofmann et al. 2006) (Fig. 2.37). Bymid-2008, the increases in the abundances of all thesegases amounted to an additional direct radiative forcingto the atmosphere totaling approximately 2.74 Wm -2 , changes in the abundance of CO 2accounting for63% of this enhanced radiative forcing.The NOAA Annual Greenhouse Gas Index(AGGI)(Hofmann et al. 2006) is calculated as a ratiorelative to the direct radiative forcing calculated fromthese gases for 1990; indirect effects (e.g., arising fromozone depletion or water-vapor feedbacks) are notconsidered. Preliminary data indicated that the <strong>2009</strong>AGGI was 1.275 (Fig. 2.37) and CO 2had accountedfor about 80% of the observed increase since 1990.Fig. 2.37. The NOAA Annual Greenhouse Gas Index(AGGI) shows radiative forcing relative to 1750, of allthe long-lived greenhouse gases indexed to 1 for theyear 1990. Since 1990, radiative forcing from greenhousegases has increased 27.5%.(iv) Nitrous oxide (N 2O) and sulfur hexafluoride(SF 6)—J. W. Elkins and G. S. DuttonNitrous oxide (N 2O) and sulfur hexafluoride (SF 6)are important atmospheric trace gases with significantman-made sources. Nitrous oxide has the thirdstrongest anthropogenic climate forcing after CO 2and CH 4and is considered a major greenhouse gas(Butler <strong>2009</strong>). Atmospheric N 2O is also responsiblefor stratospheric ozone depletion by providing asource of stratospheric nitric oxide (Ravishankaraet al. <strong>2009</strong>). The <strong>2009</strong> mean global concentration ofN 2O was 322.5 ± 0.1 ppb yr -1 (Fig. 2.38 top panel). Itsmean global growth rate since 1977 is 0.733 ± 0.002ppb but with substantial interannual variation (Fig.2.38 bottom panel). The atmospheric N 2O budget isout of balance by one-third as a result of man-madeemissions, primarily through emissions from nitrogenfertilizers (Crutzen et al. 2007).Sulfur hexafluoride has one of the strongest GlobalWarming Potentials (GWP) of all trace gases at 23 900times CO 2with a 100-yr time horizon (Solomon et al.2007) with the fifth strongest climate forcing of the10 minor greenhouse gases (Hofmann et al. 2006). Itsglobal average concentration for <strong>2009</strong> was 6.76 ± 0.07parts-per-trillion dry by mole fraction (ppt) (Fig. 2.38top panel) and thus its climate forcing contribution issmall. The atmospheric lifetime of SF 6is long (3200yr); so, many developed countries have instituted voluntaryprograms with suppliers and utilities to reducetheir emissions. The global atmospheric growth ratepeaked at 0.32 ppt yr -1 in 2008 but in <strong>2009</strong> decreased,perhaps as a result of the recent global economic recessionand voluntary efforts by countries to reduceemissions (Fig. 2.38 bottom panel).S44 | juNE 2010


