


You also want an ePaper? Increase the reach of your titles
YUMPU automatically turns print PDFs into web optimized ePapers that Google loves.
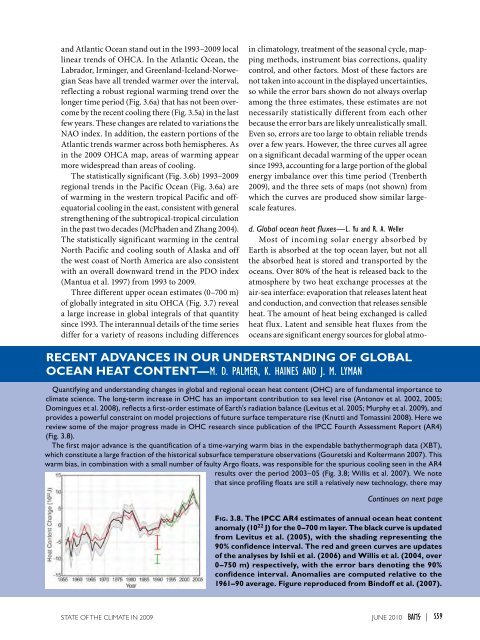
and Atlantic Ocean stand out in the 1993–<strong>2009</strong> locallinear trends of OHCA. In the Atlantic Ocean, theLabrador, Irminger, and Greenland-Iceland-NorwegianSeas have all trended warmer over the interval,reflecting a robust regional warming trend over thelonger time period (Fig. 3.6a) that has not been overcomeby the recent cooling there (Fig. 3.5a) in the lastfew years. These changes are related to variations theNAO index. In addition, the eastern portions of theAtlantic trends warmer across both hemispheres. Asin the <strong>2009</strong> OHCA map, areas of warming appearmore widespread than areas of cooling.The statistically significant (Fig. 3.6b) 1993–<strong>2009</strong>regional trends in the Pacific Ocean (Fig. 3.6a) areof warming in the western tropical Pacific and offequatorialcooling in the east, consistent with generalstrengthening of the subtropical-tropical circulationin the past two decades (McPhaden and Zhang 2004).The statistically significant warming in the centralNorth Pacific and cooling south of Alaska and offthe west coast of North America are also consistentwith an overall downward trend in the PDO index(Mantua et al. 1997) from 1993 to <strong>2009</strong>.Three different upper ocean estimates (0–700 m)of globally integrated in situ OHCA (Fig. 3.7) reveala large increase in global integrals of that quantitysince 1993. The interannual details of the time seriesdiffer for a variety of reasons including differencesin climatology, treatment of the seasonal cycle, mappingmethods, instrument bias corrections, qualitycontrol, and other factors. Most of these factors arenot taken into account in the displayed uncertainties,so while the error bars shown do not always overlapamong the three estimates, these estimates are notnecessarily statistically different from each otherbecause the error bars are likely unrealistically small.Even so, errors are too large to obtain reliable trendsover a few years. However, the three curves all agreeon a significant decadal warming of the upper oceansince 1993, accounting for a large portion of the globalenergy imbalance over this time period (Trenberth<strong>2009</strong>), and the three sets of maps (not shown) fromwhich the curves are produced show similar largescalefeatures.d. Global ocean heat fluxes—L. Yu and R. A. WellerMost of incoming solar energy absorbed byEarth is absorbed at the top ocean layer, but not allthe absorbed heat is stored and transported by theoceans. Over 80% of the heat is released back to theatmosphere by two heat exchange processes at theair-sea interface: evaporation that releases latent heatand conduction, and convection that releases sensibleheat. The amount of heat being exchanged is calledheat flux. Latent and sensible heat fluxes from theoceans are significant energy sources for global atmo-RECENT ADVANCES <strong>IN</strong> OUR UNDERSTAND<strong>IN</strong>G <strong>OF</strong> GLOBALOCEAN HEAT CONTENT—M. D. PALMer, K. HA<strong>IN</strong>ES AND J. M. LYManQuantifying and understanding changes in global and regional ocean heat content (OHC) are of fundamental importance toclimate science. The long-term increase in OHC has an important contribution to sea level rise (Antonov et al. 2002, 2005;Domingues et al. 2008), reflects a first-order estimate of Earth’s radiation balance (Levitus et al. 2005; Murphy et al. <strong>2009</strong>), andprovides a powerful constraint on model projections of future surface temperature rise (Knutti and Tomassini 2008). Here wereview some of the major progress made in OHC research since publication of the IPCC Fourth Assessment Report (AR4)(Fig. 3.8).The first major advance is the quantification of a time-varying warm bias in the expendable bathythermograph data (XBT),which constitute a large fraction of the historical subsurface temperature observations (Gouretski and Koltermann 2007). Thiswarm bias, in combination with a small number of faulty Argo floats, was responsible for the spurious cooling seen in the AR4results over the period 2003–05 (Fig. 3.8; Willis et al. 2007). We notethat since profiling floats are still a relatively new technology, there mayFig. 3.8. The IPCC AR4 estimates of annual ocean heat contentanomaly (10 22 J) for the 0–700 m layer. The black curve is updatedfrom Levitus et al. (2005), with the shading representing the90% confidence interval. The red and green curves are updatesof the analyses by Ishii et al. (2006) and Willis et al. (2004, over0–750 m) respectively, with the error bars denoting the 90%confidence interval. Anomalies are computed relative to the1961–90 average. Figure reproduced from Bindoff et al. (2007).<strong>STATE</strong> <strong>OF</strong> <strong>THE</strong> <strong>CLIMATE</strong> <strong>IN</strong> <strong>2009</strong> juNE 2010 |S59


