


You also want an ePaper? Increase the reach of your titles
YUMPU automatically turns print PDFs into web optimized ePapers that Google loves.
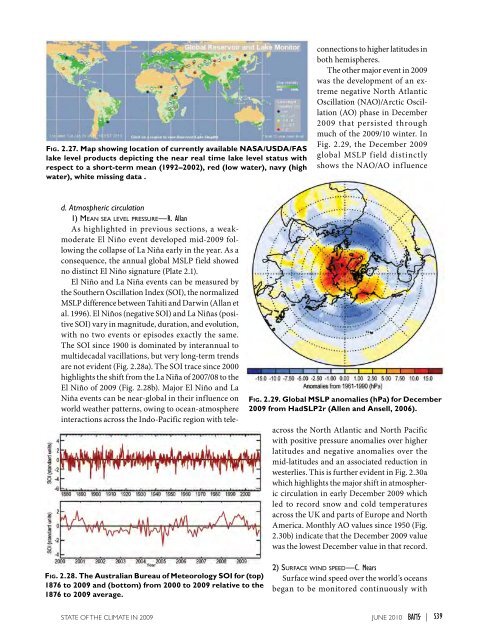
Fig. 2.27. Map showing location of currently available NASA/USDA/FASlake level products depicting the near real time lake level status withrespect to a short-term mean (1992–2002), red (low water), navy (highwater), white missing data .d. Atmospheric circulation1) Mean sea level pressure—R. AllanAs highlighted in previous sections, a weakmoderateEl Niño event developed mid-<strong>2009</strong> followingthe collapse of La Niña early in the year. As aconsequence, the annual global MSLP field showedno distinct El Niño signature (Plate 2.1).El Niño and La Niña events can be measured bythe Southern Oscillation Index (SOI), the normalizedMSLP difference between Tahiti and Darwin (Allan etal. 1996). El Niños (negative SOI) and La Niñas (positiveSOI) vary in magnitude, duration, and evolution,with no two events or episodes exactly the same.The SOI since 1900 is dominated by interannual tomultidecadal vacillations, but very long-term trendsare not evident (Fig. 2.28a). The SOI trace since 2000highlights the shift from the La Niña of 2007/08 to theEl Niño of <strong>2009</strong> (Fig. 2.28b). Major El Niño and LaNiña events can be near-global in their influence onworld weather patterns, owing to ocean-atmosphereinteractions across the Indo-Pacific region with teleconnectionsto higher latitudes inboth hemispheres.The other major event in <strong>2009</strong>was the development of an extremenegative North AtlanticOscillation (NAO)/Arctic Oscillation(AO) phase in December<strong>2009</strong> that persisted throughmuch of the <strong>2009</strong>/10 winter. InFig. 2.29, the December <strong>2009</strong>global MSLP field distinctlyshows the NAO/AO influenceFig. 2.29. Global MSLP anomalies (hPa) for December<strong>2009</strong> from HadSLP2r (Allen and Ansell, 2006).across the North Atlantic and North Pacificwith positive pressure anomalies over higherlatitudes and negative anomalies over themid-latitudes and an associated reduction inwesterlies. This is further evident in Fig. 2.30awhich highlights the major shift in atmosphericcirculation in early December <strong>2009</strong> whichled to record snow and cold temperaturesacross the UK and parts of Europe and NorthAmerica. Monthly AO values since 1950 (Fig.2.30b) indicate that the December <strong>2009</strong> valuewas the lowest December value in that record.Fig. 2.28. The Australian Bureau of Meteorology SOI for (top)1876 to <strong>2009</strong> and (bottom) from 2000 to <strong>2009</strong> relative to the1876 to <strong>2009</strong> average.2) Surface wind speed—C. MearsSurface wind speed over the world’s oceansbegan to be monitored continuously with<strong>STATE</strong> <strong>OF</strong> <strong>THE</strong> <strong>CLIMATE</strong> <strong>IN</strong> <strong>2009</strong> juNE 2010 |S39


