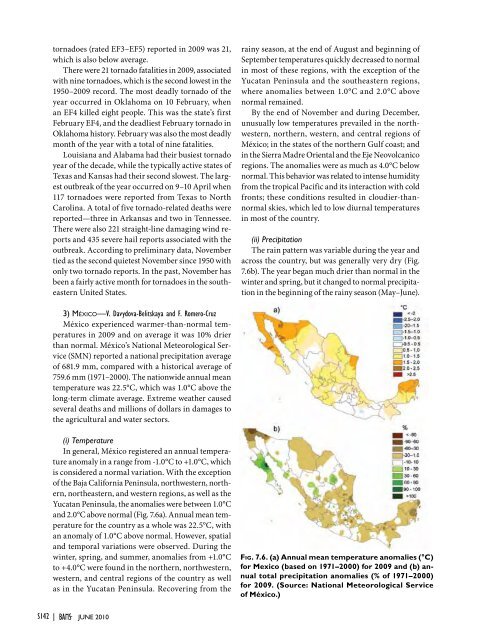
tornadoes (rated EF3–EF5) reported in <strong>2009</strong> was 21,which is also below average.There were 21 tornado fatalities in <strong>2009</strong>, associatedwith nine tornadoes, which is the second lowest in the1950–<strong>2009</strong> record. The most deadly tornado of theyear occurred in Oklahoma on 10 February, whenan EF4 killed eight people. This was the state’s firstFebruary EF4, and the deadliest February tornado inOklahoma history. February was also the most deadlymonth of the year with a total of nine fatalities.Louisiana and Alabama had their busiest tornadoyear of the decade, while the typically active states ofTexas and Kansas had their second slowest. The largestoutbreak of the year occurred on 9–10 April when117 tornadoes were reported from Texas to NorthCarolina. A total of five tornado-related deaths werereported—three in Arkansas and two in Tennessee.There were also 221 straight-line damaging wind reportsand 435 severe hail reports associated with theoutbreak. According to preliminary data, Novembertied as the second quietest November since 1950 withonly two tornado reports. In the past, November hasbeen a fairly active month for tornadoes in the southeasternUnited States.rainy season, at the end of August and beginning ofSeptember temperatures quickly decreased to normalin most of these regions, with the exception of theYucatan Peninsula and the southeastern regions,where anomalies between 1.0°C and 2.0°C abovenormal remained.By the end of November and during December,unusually low temperatures prevailed in the northwestern,northern, western, and central regions ofMéxico; in the states of the northern Gulf coast; andin the Sierra Madre Oriental and the Eje Neovolcanicoregions. The anomalies were as much as 4.0°C belownormal. This behavior was related to intense humidityfrom the tropical Pacific and its interaction with coldfronts; these conditions resulted in cloudier-thannormalskies, which led to low diurnal temperaturesin most of the country.(ii) PrecipitationThe rain pattern was variable during the year andacross the country, but was generally very dry (Fig.7.6b). The year began much drier than normal in thewinter and spring, but it changed to normal precipitationin the beginning of the rainy season (May–June).3) México—V. Davydova-Belitskaya and F. Romero-CruzMéxico experienced warmer-than-normal temperaturesin <strong>2009</strong> and on average it was 10% drierthan normal. México’s National Meteorological Service(SMN) reported a national precipitation averageof 681.9 mm, compared with a historical average of759.6 mm (1971–2000). The nationwide annual meantemperature was 22.5°C, which was 1.0°C above thelong-term climate average. Extreme weather causedseveral deaths and millions of dollars in damages tothe agricultural and water sectors.(i) TemperatureIn general, México registered an annual temperatureanomaly in a range from -1.0°C to +1.0°C, whichis considered a normal variation. With the exceptionof the Baja California Peninsula, northwestern, northern,northeastern, and western regions, as well as theYucatan Peninsula, the anomalies were between 1.0°Cand 2.0°C above normal (Fig. 7.6a). Annual mean temperaturefor the country as a whole was 22.5°C, withan anomaly of 1.0°C above normal. However, spatialand temporal variations were observed. During thewinter, spring, and summer, anomalies from +1.0°Cto +4.0°C were found in the northern, northwestern,western, and central regions of the country as wellas in the Yucatan Peninsula. Recovering from theFig. 7.6. (a) Annual mean temperature anomalies (°C)for Mexico (based on 1971–2000) for <strong>2009</strong> and (b) annualtotal precipitation anomalies (% of 1971–2000)for <strong>2009</strong>. (Source: National Meteorological Serviceof México.)S142 | juNE 2010
The first drought occurred in March and April andproduced some impacts in the southern and southeasternstates of the country. Thousands of livestockand hundreds of thousands of dollars U.S. were lost bythe end of April, seriously impacting the economy ofTabasco. The development of the rainy season duringMay and June allowed the scheduled farming activitiesin most of the country; however, a new droughtdeveloped as a consequence of the fast appearance ofEl Niño. This drought episode hit agricultural, cattle,and water sectors in most of México.Precipitation statistics ranked July <strong>2009</strong> as thedriest since 1941 at a national level. Due to the devastatingimpacts, some farmer organizations in thecentral region of the country declared the event asthe worst drought in 70 years.Precipitation recovered in the western, central, andsouthern areas of México in the beginning of September,with an exceptionally wet autumn. However, thetotal annual precipitation reported by the NationalMeteorological Service was below normal (Fig. 7.6b).The largest negative annual anomalies were registeredin Distrito Federal (-47.7%), Nayarit (-24.7%), Tabasco(-23.6%), Yucatan (-22.7%), Quintana Roo (-22.4%),Aguascalientes (-22.2%), Sinaloa (-20.0%), Estado deMéxico (-19.8%), Jalisco (-18.4%), Michoacán (-18.3%),Veracruz (-16.8%), Morelos (-14.9%), Chiapas (-14.5%),Queretaro (-12.4%), and Chihuahua (-11.8%). Onlyfive of the 32 states of Mexico reported rainfall abovenormal: Baja California Sur (+69.6%), Baja California(+26.6%), Hidalgo (+11.3%), Zacatecas (+6.7%), andSonora (+4.5%).(iii) WildfiresAccording the National Forest Commission(CONAFOR) reports less than 10 000 wildfires wereobserved during <strong>2009</strong> in the country. Most were registeredduring the period from February through July.The states with the highest occurrence of fires wereMéxico, Distrito Federal, Michoacán, Chihuahua,Puebla, Jalisco, Chiapas, Tlaxcala, Hidalgo, and BajaCalifornia. Those with the highest affected areas wereBaja California, Quintana Roo, Coahuila, Yucatán,Oaxaca, Zacatecas, Chiapas, Michoacán, Guerrero,and Chihuahua.c. Central America and the Caribbean1) Central America—J. A. Amador, E. J. Alfaro, H. G.Hidalgo, E. R. Rivera, and B. CalderonFor this region, seven stations from the followingfive countries were analyzed: Belize, Honduras, CostaRica, Panama, and Guatemala.(i) TemperatureMost stations located on the Pacific coast show, for<strong>2009</strong>, very little surface temperature departures fromFig. 7.7. Central America showing the location of selected stations: 1. Phillip Goldson Int. Airport, Belize; 2.Puerto Lempira, Honduras; 3. Puerto Limon, Costa Rica; 4. David, Panama; 5. Liberia, Costa Rica; 6. Choluteca,Honduras; and 7. San Jose, Guatemala. For each station, surface temperature frequency is shown onthe left and accumulated pentad precipitation on the right. Blue represents climatology for the base period1971–2000, red the 2000–09 decade and green <strong>2009</strong>. Note that San Jose does not show <strong>2009</strong> precipitation datadue to large amount of missing data. (Source: NOAA/NCDC.)<strong>STATE</strong> <strong>OF</strong> <strong>THE</strong> <strong>CLIMATE</strong> <strong>IN</strong> <strong>2009</strong> juNE 2010 |S143
- Page 8 and 9:
Luo, Jing-Jia, Research Institute f
- Page 10 and 11:
Tedesco, Marco, Department Earth an
- Page 12 and 13:
4. THE TROPICS.....................
- Page 14 and 15:
ABSTRACT—M. O. Baringer, D. S. Ar
- Page 16 and 17:
I. INTRODUCTION—M. O. Baringer an
- Page 18 and 19:
Table 1.1 The GCOS Essential Climat
- Page 20 and 21:
S18 | juNE 2010
- Page 22 and 23:
Stratospheric TemperatureCloudiness
- Page 25:
Source Datasets Sectionhttp://www.p
- Page 28 and 29:
HOW do WE KNOW THE WORLD HAS WARMED
- Page 30 and 31:
Fig. 2.6. As for Fig. 2.1 but for l
- Page 32 and 33:
Fig. 2.10. Change in TCWV from 2008
- Page 34 and 35:
Precipitation anomalies in 2009, ov
- Page 36 and 37:
Fig. 2.18. Seasonal SCE anomalies (
- Page 38 and 39:
USING SI-TRACABLE GLOBAL POSITIONIN
- Page 40 and 41:
6) Lake levels—C. BirkettLake vol
- Page 42 and 43:
Fig. 2.30. (a) The daily AO index f
- Page 45 and 46:
(C) Carbon monoxide (CO)There has b
- Page 47 and 48:
Table 2.5. Mixing ratios, radiative
- Page 50 and 51:
the mid-1990s but has since levelle
- Page 52 and 53:
with all 42 glaciers observed retre
- Page 54 and 55:
of 0.1° and 5 days (Kaiser et al.
- Page 56 and 57:
Fig. 3.1. (a) Yearly mean SSTAs in
- Page 58 and 59:
(Fig. 3.3c). It is interesting that
- Page 60 and 61:
strong there, consistent with anoma
- Page 62 and 63:
cont'RECENT ADVANCES IN OUR UNDERST
- Page 64 and 65:
is to cause SST to rise if oceanic
- Page 66 and 67:
egions around the subtropical salin
- Page 68 and 69:
Fig 3.17. Principal empirical ortho
- Page 70 and 71:
Fig. 3.19. Daily estimates of the s
- Page 72 and 73:
Fig. 3.22. (top) The 2009 SSH anoma
- Page 74 and 75:
to update the CO 2climatology, ther
- Page 76 and 77:
µmol kg -1 or about half of the ac
- Page 78 and 79:
Fig. 3.31. (a) Average MODIS-Aqua C
- Page 80 and 81:
latitudes, chlorophyll and thermal
- Page 83 and 84:
Fig. 4.4. (a) Anomalous 850-hPa win
- Page 85 and 86:
(Fig. 4.6). These include four MJO
- Page 87 and 88:
Fig. 4.8. NOAA’s ACE index expres
- Page 89 and 90:
Fig. 4.14. ASO 2009: Anomalous 200-
- Page 91 and 92:
Fig. 4.17. The tracks of all TCs th
- Page 93 and 94: Several previous studies have shown
- Page 95 and 96: followed by TY Linfa and TS Nangka
- Page 97 and 98: The Philippines were severely affec
- Page 99 and 100: The historical SIO TC data is proba
- Page 101 and 102: Fig. 4.26. Global anomalies of TCHP
- Page 103 and 104: degree resolution NASA TRMM rainfal
- Page 105 and 106: F i g. 4.32 . TRMM (a) mean and (b)
- Page 107 and 108: THE forgotten sub-BASIN—THE centr
- Page 109 and 110: 5. THE ARCTIC—J. Richter-Menge, E
- Page 111 and 112: and North America (south of 55° la
- Page 113 and 114: Fig. 5.8. 2007-09 Atlantic water la
- Page 115 and 116: d. Sea ice cover—D. Perovich, R.
- Page 117 and 118: e. Land1) Vegetation—D. A. Walker
- Page 119 and 120: Fig. 5.18. Total annual river disch
- Page 121 and 122: negative SCD anomalies were evident
- Page 123 and 124: with records beginning in 1873, the
- Page 125 and 126: (QuikSCAT, 2000-09) microwave remot
- Page 127 and 128: 6. ANTARCTICAa. Overview—R. L. Fo
- Page 129 and 130: (SCAR) report ‘Antarctic Climate
- Page 131 and 132: these stations in April, August, an
- Page 133 and 134: e. 2008-2009 Seasonal melt extent a
- Page 135 and 136: positive ice-season duration anomal
- Page 137 and 138: 7. REGIONAL CLIMATESa. Introduction
- Page 139 and 140: first half of the year (January-Jun
- Page 141 and 142: its second wettest such period. Sev
- Page 143: California began the year with mode
- Page 147 and 148: Fig. 7.8. (a) Annual mean temperatu
- Page 149 and 150: Fig. 7.11. (a) Annual mean temperat
- Page 151 and 152: EXTREME rainfall and the flood of t
- Page 153 and 154: Fig. 7.14. Composite for standardiz
- Page 155 and 156: Fig. 7.17. Daily maximum temperatur
- Page 157 and 158: (ii) PrecipitationDecember to Febru
- Page 159 and 160: For Zimbabwe, the rainfall season,
- Page 161 and 162: Fig. 7.28. Annual mean temperature
- Page 163 and 164: Fig. 7.31. Seasonal anomalies (1961
- Page 165 and 166: (1706-2009), and new national recor
- Page 167 and 168: cold in southern and central Finlan
- Page 169 and 170: EXCEPTIONAL storm strikes northern
- Page 171 and 172: 7.32b). April was particularly mild
- Page 173 and 174: to -44 о С) persisted in southern
- Page 175 and 176: Fig. 7.39. Weather conditions in De
- Page 177 and 178: on the 1971-2000 climatology) for a
- Page 179 and 180: excess rainfall, while 11 subdivisi
- Page 181 and 182: 4) Southwest Asia(i) Iraq—M. Roge
- Page 183 and 184: Wales. The warmth was particularly
- Page 185 and 186: The most significant severe thunder
- Page 187 and 188: mm thick, which fell on parts of No
- Page 189 and 190: and Vanua Levu islands (Fiji) as a
- Page 191 and 192: Table 7.5. Maximum temperature anom
- Page 193 and 194: 8. SEASONAL SUMMARIES—Mike Halper
- Page 195 and 196:
Fig. 8.5. Jun-Aug 2009 (top) surfac
- Page 197 and 198:
ACKNOWLEDGMENTSIn addition to the m
- Page 199 and 200:
CFCCFC-11CFC-12CH 4Chl satCIIFENClC
- Page 201 and 202:
OAFlux Objectively Analyzed Air-Sea
- Page 203 and 204:
Ashok, K., S. K. Behera, S. A. Rao,
- Page 205 and 206:
Cangialosi, J. P., and L. A. Avila,
- Page 207 and 208:
Francis, J. A., W. Chan, D. J. Leat
- Page 209 and 210:
Hudson, J. M. G., and G. H. R. Henr
- Page 211 and 212:
Landsea, C. W., and W. M. Gray, 199
- Page 213 and 214:
Meinen, C. S., M. O. Baringer, and
- Page 215 and 216:
Ramaswamy, V., M. D. Schwarzkopf, W
- Page 217 and 218:
——, ——, T. C. Peterson, and
- Page 219 and 220:
Wang, L., C. Derksen, and R. Brown,
- Page 224:
Monthly average temperature anomali