


Create successful ePaper yourself
Turn your PDF publications into a flip-book with our unique Google optimized e-Paper software.
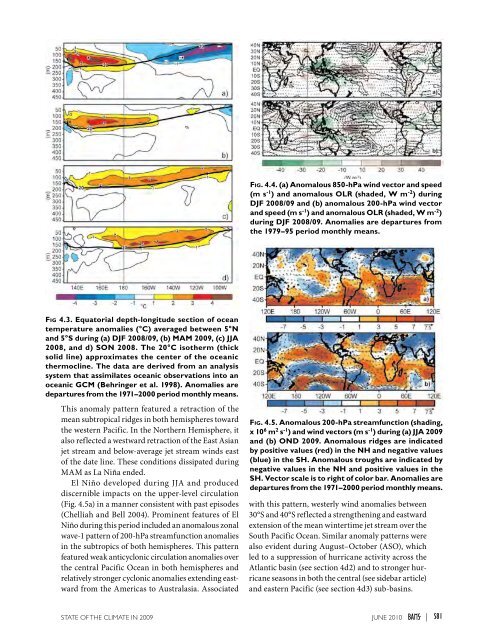
Fig. 4.4. (a) Anomalous 850-hPa wind vector and speed(m s -1 ) and anomalous OLR (shaded, W m -2 ) duringDJF 2008/09 and (b) anomalous 200-hPa wind vectorand speed (m s -1 ) and anomalous OLR (shaded, W m -2 )during DJF 2008/09. Anomalies are departures fromthe 1979–95 period monthly means.Fig 4.3. Equatorial depth-longitude section of oceantemperature anomalies (°C) averaged between 5°Nand 5°S during (a) DJF 2008/09, (b) MAM <strong>2009</strong>, (c) JJA2008, and d) SON 2008. The 20°C isotherm (thicksolid line) approximates the center of the oceanicthermocline. The data are derived from an analysissystem that assimilates oceanic observations into anoceanic GCM (Behringer et al. 1998). Anomalies aredepartures from the 1971–2000 period monthly means.This anomaly pattern featured a retraction of themean subtropical ridges in both hemispheres towardthe western Pacific. In the Northern Hemisphere, italso reflected a westward retraction of the East Asianjet stream and below-average jet stream winds eastof the date line. These conditions dissipated duringMAM as La Niña ended.El Niño developed during JJA and produceddiscernible impacts on the upper-level circulation(Fig. 4.5a) in a manner consistent with past episodes(Chelliah and Bell 2004). Prominent features of ElNiño during this period included an anomalous zonalwave-1 pattern of 200-hPa streamfunction anomaliesin the subtropics of both hemispheres. This patternfeatured weak anticyclonic circulation anomalies overthe central Pacific Ocean in both hemispheres andrelatively stronger cyclonic anomalies extending eastwardfrom the Americas to Australasia. AssociatedFig. 4.5. Anomalous 200-hPa streamfunction (shading,x 10 6 m 2 s -1 ) and wind vectors (m s -1 ) during (a) JJA <strong>2009</strong>and (b) OND <strong>2009</strong>. Anomalous ridges are indicatedby positive values (red) in the NH and negative values(blue) in the SH. Anomalous troughs are indicated bynegative values in the NH and positive values in theSH. Vector scale is to right of color bar. Anomalies aredepartures from the 1971–2000 period monthly means.with this pattern, westerly wind anomalies between30°S and 40°S reflected a strengthening and eastwardextension of the mean wintertime jet stream over theSouth Pacific Ocean. Similar anomaly patterns werealso evident during August–October (ASO), whichled to a suppression of hurricane activity across theAtlantic basin (see section 4d2) and to stronger hurricaneseasons in both the central (see sidebar article)and eastern Pacific (see section 4d3) sub-basins.<strong>STATE</strong> <strong>OF</strong> <strong>THE</strong> <strong>CLIMATE</strong> <strong>IN</strong> <strong>2009</strong> juNE 2010 |S81


