Fig. 7.33. Seasonal anomalies, with respect to the 1961-90 mean, of sea level pressure (hPa) from NCAR/NCEPreanalyses. Colored shading represents the percentageof accumulated seasonal precipitation compared withthe 1951–2000 climatology from the seasonal GPCCprecipitation data set (only values above 15 mm perseason are represented). Thick black lines highlightthose sea level pressure anomalies which are greaterthan one standard deviation above the mean.and western Russia, where temperature anomaliesexceeded +3°C. Increased cyclonicity led to wellabove-averageNovember precipitation, particularlyin the northern half of Europe with new records setacross Ireland and the UK.The end of the year was characterized by an extremelynegative phase of the Arctic Oscillation (AO)with high pressures dominating the higher latitudesof the Northern Hemisphere, affecting the weatherin Europe. The AO Index in December <strong>2009</strong> was-3.4, the lowest value observed for thatmonth in 60 years (Fig. 2.30b in Section2d), with extremely negative values in thesecond half of the month. Most of Europewas under the influence of a stronghigh pressure system over the Arcticand Scandinavia that favored intenseadvection of cold polar air far into themiddle latitudes (Trigo et al. 2004). Thenegative North American Oscillationindex in December also contributed toa starkly contrasting temperature patternover Europe. While SoutheasternEurope and parts of the polar region(Greenland, Iceland, Svalbard) experiencedmild temperatures—GreenlandS162 | juNE 2010was 7°C warmer than average—colder-than-averageconditions prevailed over the northern half of Europewith heavy snowfall in places. The Scandinavian highpressure also caused a dry December in NorthernEurope, while most of the rest of Europe, particularlythe South, experienced a very wet end of the year.2) Central and Western Europe—A. Obregón, P. Bissolli,J. J. Kennedy, and D.E. ParkerCountries considered in this section include: Ireland,the United Kingdom, the Netherlands, Belgium,Luxembourg, France, Germany, Switzerland, Austria,Poland, Czech Republic, Slovakia, and Hungary.(i) TemperatureAnnual mean temperatures in Central Europewere 1°C–2°C above the 1961–90 average throughoutmost of the region (Fig. 7.29). Over Western Europe,anomalies were mostly below +1°C.Winter 2008/09 was the coldest in the UK since1996/97. In France, it was the third coldest winter in20 years. Severe cold waves during January and Februarybrought temperatures below -25°C to Germanyand Poland. The lowest recorded daily minimumtemperature in <strong>2009</strong> in Poland was -28.2°C in thesouthwest of the country on 7 January. A privateweather service station in Saxony, eastern Germany,recorded -29.1°C on the same day. In contrast, winterwas warmer than average in the easternmost regions(Poland, Czech Republic, Slovakia, Austria, andHungary; Fig. 7.32a).Spring temperatures were well above average,mainly due to an exceptionally warm April (Fig. 7.34).Belgium and Switzerland each reported their secondwarmest spring on record. April was the secondwarmest on record for De Bilt in the NetherlandsFig. 7.34.Monthly mean anomalies of surface air temperature acrossEurope and over the North Atlantic, April <strong>2009</strong> (1961–90 base period)based on CLIMAT and ship observations. [Source: DeutscherWetterdienst (DWD).]
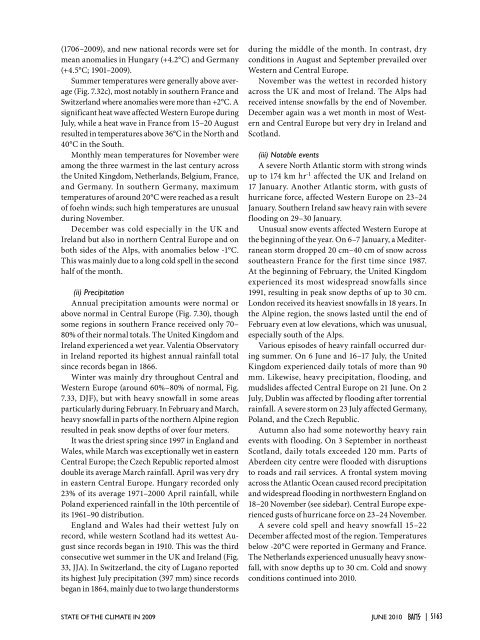
(1706–<strong>2009</strong>), and new national records were set formean anomalies in Hungary (+4.2°C) and Germany(+4.5°C; 1901–<strong>2009</strong>).Summer temperatures were generally above average(Fig. 7.32c), most notably in southern France andSwitzerland where anomalies were more than +2°C. Asignificant heat wave affected Western Europe duringJuly, while a heat wave in France from 15–20 Augustresulted in temperatures above 36°C in the North and40°C in the South.Monthly mean temperatures for November wereamong the three warmest in the last century acrossthe United Kingdom, Netherlands, Belgium, France,and Germany. In southern Germany, maximumtemperatures of around 20°C were reached as a resultof foehn winds; such high temperatures are unusualduring November.December was cold especially in the UK andIreland but also in northern Central Europe and onboth sides of the Alps, with anomalies below -1°C.This was mainly due to a long cold spell in the secondhalf of the month.(ii) PrecipitationAnnual precipitation amounts were normal orabove normal in Central Europe (Fig. 7.30), thoughsome regions in southern France received only 70–80% of their normal totals. The United Kingdom andIreland experienced a wet year. Valentia Observatoryin Ireland reported its highest annual rainfall totalsince records began in 1866.Winter was mainly dry throughout Central andWestern Europe (around 60%–80% of normal, Fig.7.33, DJF), but with heavy snowfall in some areasparticularly during February. In February and March,heavy snowfall in parts of the northern Alpine regionresulted in peak snow depths of over four meters.It was the driest spring since 1997 in England andWales, while March was exceptionally wet in easternCentral Europe; the Czech Republic reported almostdouble its average March rainfall. April was very dryin eastern Central Europe. Hungary recorded only23% of its average 1971–2000 April rainfall, whilePoland experienced rainfall in the 10th percentile ofits 1961–90 distribution.England and Wales had their wettest July onrecord, while western Scotland had its wettest Augustsince records began in 1910. This was the thirdconsecutive wet summer in the UK and Ireland (Fig.33, JJA). In Switzerland, the city of Lugano reportedits highest July precipitation (397 mm) since recordsbegan in 1864, mainly due to two large thunderstormsduring the middle of the month. In contrast, dryconditions in August and September prevailed overWestern and Central Europe.November was the wettest in recorded historyacross the UK and most of Ireland. The Alps hadreceived intense snowfalls by the end of November.December again was a wet month in most of Westernand Central Europe but very dry in Ireland andScotland.(iii) Notable eventsA severe North Atlantic storm with strong windsup to 174 km hr -1 affected the UK and Ireland on17 January. Another Atlantic storm, with gusts ofhurricane force, affected Western Europe on 23–24January. Southern Ireland saw heavy rain with severeflooding on 29–30 January.Unusual snow events affected Western Europe atthe beginning of the year. On 6–7 January, a Mediterraneanstorm dropped 20 cm–40 cm of snow acrosssoutheastern France for the first time since 1987.At the beginning of February, the United Kingdomexperienced its most widespread snowfalls since1991, resulting in peak snow depths of up to 30 cm.London received its heaviest snowfalls in 18 years. Inthe Alpine region, the snows lasted until the end ofFebruary even at low elevations, which was unusual,especially south of the Alps.Various episodes of heavy rainfall occurred duringsummer. On 6 June and 16–17 July, the UnitedKingdom experienced daily totals of more than 90mm. Likewise, heavy precipitation, flooding, andmudslides affected Central Europe on 21 June. On 2July, Dublin was affected by flooding after torrentialrainfall. A severe storm on 23 July affected Germany,Poland, and the Czech Republic.Autumn also had some noteworthy heavy rainevents with flooding. On 3 September in northeastScotland, daily totals exceeded 120 mm. Parts ofAberdeen city centre were flooded with disruptionsto roads and rail services. A frontal system movingacross the Atlantic Ocean caused record precipitationand widespread flooding in northwestern England on18–20 November (see sidebar). Central Europe experiencedgusts of hurricane force on 23–24 November.A severe cold spell and heavy snowfall 15–22December affected most of the region. Temperaturesbelow -20°C were reported in Germany and France.The Netherlands experienced unusually heavy snowfall,with snow depths up to 30 cm. Cold and snowyconditions continued into 2010.<strong>STATE</strong> <strong>OF</strong> <strong>THE</strong> <strong>CLIMATE</strong> <strong>IN</strong> <strong>2009</strong> juNE 2010 |S163
- Page 8 and 9:
Luo, Jing-Jia, Research Institute f
- Page 10 and 11:
Tedesco, Marco, Department Earth an
- Page 12 and 13:
4. THE TROPICS.....................
- Page 14 and 15:
ABSTRACT—M. O. Baringer, D. S. Ar
- Page 16 and 17:
I. INTRODUCTION—M. O. Baringer an
- Page 18 and 19:
Table 1.1 The GCOS Essential Climat
- Page 20 and 21:
S18 | juNE 2010
- Page 22 and 23:
Stratospheric TemperatureCloudiness
- Page 25:
Source Datasets Sectionhttp://www.p
- Page 28 and 29:
HOW do WE KNOW THE WORLD HAS WARMED
- Page 30 and 31:
Fig. 2.6. As for Fig. 2.1 but for l
- Page 32 and 33:
Fig. 2.10. Change in TCWV from 2008
- Page 34 and 35:
Precipitation anomalies in 2009, ov
- Page 36 and 37:
Fig. 2.18. Seasonal SCE anomalies (
- Page 38 and 39:
USING SI-TRACABLE GLOBAL POSITIONIN
- Page 40 and 41:
6) Lake levels—C. BirkettLake vol
- Page 42 and 43:
Fig. 2.30. (a) The daily AO index f
- Page 45 and 46:
(C) Carbon monoxide (CO)There has b
- Page 47 and 48:
Table 2.5. Mixing ratios, radiative
- Page 50 and 51:
the mid-1990s but has since levelle
- Page 52 and 53:
with all 42 glaciers observed retre
- Page 54 and 55:
of 0.1° and 5 days (Kaiser et al.
- Page 56 and 57:
Fig. 3.1. (a) Yearly mean SSTAs in
- Page 58 and 59:
(Fig. 3.3c). It is interesting that
- Page 60 and 61:
strong there, consistent with anoma
- Page 62 and 63:
cont'RECENT ADVANCES IN OUR UNDERST
- Page 64 and 65:
is to cause SST to rise if oceanic
- Page 66 and 67:
egions around the subtropical salin
- Page 68 and 69:
Fig 3.17. Principal empirical ortho
- Page 70 and 71:
Fig. 3.19. Daily estimates of the s
- Page 72 and 73:
Fig. 3.22. (top) The 2009 SSH anoma
- Page 74 and 75:
to update the CO 2climatology, ther
- Page 76 and 77:
µmol kg -1 or about half of the ac
- Page 78 and 79:
Fig. 3.31. (a) Average MODIS-Aqua C
- Page 80 and 81:
latitudes, chlorophyll and thermal
- Page 83 and 84:
Fig. 4.4. (a) Anomalous 850-hPa win
- Page 85 and 86:
(Fig. 4.6). These include four MJO
- Page 87 and 88:
Fig. 4.8. NOAA’s ACE index expres
- Page 89 and 90:
Fig. 4.14. ASO 2009: Anomalous 200-
- Page 91 and 92:
Fig. 4.17. The tracks of all TCs th
- Page 93 and 94:
Several previous studies have shown
- Page 95 and 96:
followed by TY Linfa and TS Nangka
- Page 97 and 98:
The Philippines were severely affec
- Page 99 and 100:
The historical SIO TC data is proba
- Page 101 and 102:
Fig. 4.26. Global anomalies of TCHP
- Page 103 and 104:
degree resolution NASA TRMM rainfal
- Page 105 and 106:
F i g. 4.32 . TRMM (a) mean and (b)
- Page 107 and 108:
THE forgotten sub-BASIN—THE centr
- Page 109 and 110:
5. THE ARCTIC—J. Richter-Menge, E
- Page 111 and 112:
and North America (south of 55° la
- Page 113 and 114: Fig. 5.8. 2007-09 Atlantic water la
- Page 115 and 116: d. Sea ice cover—D. Perovich, R.
- Page 117 and 118: e. Land1) Vegetation—D. A. Walker
- Page 119 and 120: Fig. 5.18. Total annual river disch
- Page 121 and 122: negative SCD anomalies were evident
- Page 123 and 124: with records beginning in 1873, the
- Page 125 and 126: (QuikSCAT, 2000-09) microwave remot
- Page 127 and 128: 6. ANTARCTICAa. Overview—R. L. Fo
- Page 129 and 130: (SCAR) report ‘Antarctic Climate
- Page 131 and 132: these stations in April, August, an
- Page 133 and 134: e. 2008-2009 Seasonal melt extent a
- Page 135 and 136: positive ice-season duration anomal
- Page 137 and 138: 7. REGIONAL CLIMATESa. Introduction
- Page 139 and 140: first half of the year (January-Jun
- Page 141 and 142: its second wettest such period. Sev
- Page 143 and 144: California began the year with mode
- Page 145 and 146: The first drought occurred in March
- Page 147 and 148: Fig. 7.8. (a) Annual mean temperatu
- Page 149 and 150: Fig. 7.11. (a) Annual mean temperat
- Page 151 and 152: EXTREME rainfall and the flood of t
- Page 153 and 154: Fig. 7.14. Composite for standardiz
- Page 155 and 156: Fig. 7.17. Daily maximum temperatur
- Page 157 and 158: (ii) PrecipitationDecember to Febru
- Page 159 and 160: For Zimbabwe, the rainfall season,
- Page 161 and 162: Fig. 7.28. Annual mean temperature
- Page 163: Fig. 7.31. Seasonal anomalies (1961
- Page 167 and 168: cold in southern and central Finlan
- Page 169 and 170: EXCEPTIONAL storm strikes northern
- Page 171 and 172: 7.32b). April was particularly mild
- Page 173 and 174: to -44 о С) persisted in southern
- Page 175 and 176: Fig. 7.39. Weather conditions in De
- Page 177 and 178: on the 1971-2000 climatology) for a
- Page 179 and 180: excess rainfall, while 11 subdivisi
- Page 181 and 182: 4) Southwest Asia(i) Iraq—M. Roge
- Page 183 and 184: Wales. The warmth was particularly
- Page 185 and 186: The most significant severe thunder
- Page 187 and 188: mm thick, which fell on parts of No
- Page 189 and 190: and Vanua Levu islands (Fiji) as a
- Page 191 and 192: Table 7.5. Maximum temperature anom
- Page 193 and 194: 8. SEASONAL SUMMARIES—Mike Halper
- Page 195 and 196: Fig. 8.5. Jun-Aug 2009 (top) surfac
- Page 197 and 198: ACKNOWLEDGMENTSIn addition to the m
- Page 199 and 200: CFCCFC-11CFC-12CH 4Chl satCIIFENClC
- Page 201 and 202: OAFlux Objectively Analyzed Air-Sea
- Page 203 and 204: Ashok, K., S. K. Behera, S. A. Rao,
- Page 205 and 206: Cangialosi, J. P., and L. A. Avila,
- Page 207 and 208: Francis, J. A., W. Chan, D. J. Leat
- Page 209 and 210: Hudson, J. M. G., and G. H. R. Henr
- Page 211 and 212: Landsea, C. W., and W. M. Gray, 199
- Page 213 and 214: Meinen, C. S., M. O. Baringer, and
- Page 215 and 216:
Ramaswamy, V., M. D. Schwarzkopf, W
- Page 217 and 218:
——, ——, T. C. Peterson, and
- Page 219 and 220:
Wang, L., C. Derksen, and R. Brown,
- Page 224:
Monthly average temperature anomali