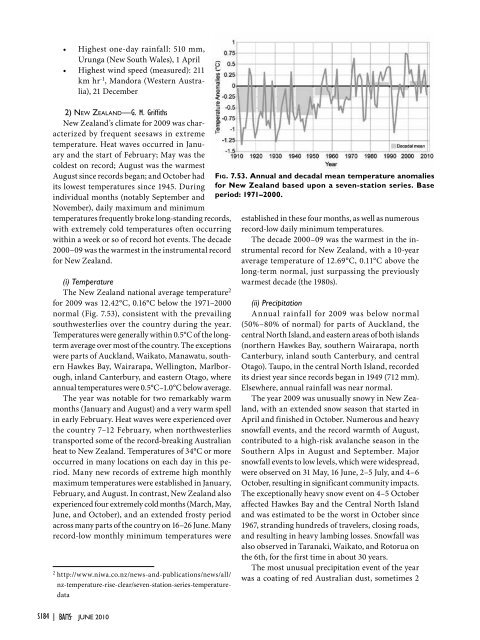
• Highest one-day rainfall: 510 mm,Urunga (New South Wales), 1 April• Highest wind speed (measured): 211km hr -1 , Mandora (Western Australia),21 December2) New Zealand—G. M. GriffithsNew Zealand’s climate for <strong>2009</strong> was characterizedby frequent seesaws in extremetemperature. Heat waves occurred in Januaryand the start of February; May was thecoldest on record; August was the warmestAugust since records began; and October hadits lowest temperatures since 1945. Duringindividual months (notably September andNovember), daily maximum and minimumtemperatures frequently broke long-standing records,with extremely cold temperatures often occurringwithin a week or so of record hot events. The decade2000–09 was the warmest in the instrumental recordfor New Zealand.(i) TemperatureThe New Zealand national average temperature 2for <strong>2009</strong> was 12.42°C, 0.16°C below the 1971–2000normal (Fig. 7.53), consistent with the prevailingsouthwesterlies over the country during the year.Temperatures were generally within 0.5°C of the longtermaverage over most of the country. The exceptionswere parts of Auckland, Waikato, Manawatu, southernHawkes Bay, Wairarapa, Wellington, Marlborough,inland Canterbury, and eastern Otago, whereannual temperatures were 0.5°C–1.0°C below average.The year was notable for two remarkably warmmonths (January and August) and a very warm spellin early February. Heat waves were experienced overthe country 7–12 February, when northwesterliestransported some of the record-breaking Australianheat to New Zealand. Temperatures of 34°C or moreoccurred in many locations on each day in this period.Many new records of extreme high monthlymaximum temperatures were established in January,February, and August. In contrast, New Zealand alsoexperienced four extremely cold months (March, May,June, and October), and an extended frosty periodacross many parts of the country on 16–26 June. Manyrecord-low monthly minimum temperatures were2http://www.niwa.co.nz/news-and-publications/news/all/nz-temperature-rise-clear/seven-station-series-temperaturedataS184 | juNE 2010Fig. 7.53. Annual and decadal mean temperature anomaliesfor New Zealand based upon a seven-station series. Baseperiod: 1971–2000.established in these four months, as well as numerousrecord-low daily minimum temperatures.The decade 2000–09 was the warmest in the instrumentalrecord for New Zealand, with a 10-yearaverage temperature of 12.69°C, 0.11°C above thelong-term normal, just surpassing the previouslywarmest decade (the 1980s).(ii) PrecipitationAnnual rainfall for <strong>2009</strong> was below normal(50%–80% of normal) for parts of Auckland, thecentral North Island, and eastern areas of both islands(northern Hawkes Bay, southern Wairarapa, northCanterbury, inland south Canterbury, and centralOtago). Taupo, in the central North Island, recordedits driest year since records began in 1949 (712 mm).Elsewhere, annual rainfall was near normal.The year <strong>2009</strong> was unusually snowy in New Zealand,with an extended snow season that started inApril and finished in October. Numerous and heavysnowfall events, and the record warmth of August,contributed to a high-risk avalanche season in theSouthern Alps in August and September. Majorsnowfall events to low levels, which were widespread,were observed on 31 May, 16 June, 2–5 July, and 4–6October, resulting in significant community impacts.The exceptionally heavy snow event on 4–5 Octoberaffected Hawkes Bay and the Central North Islandand was estimated to be the worst in October since1967, stranding hundreds of travelers, closing roads,and resulting in heavy lambing losses. Snowfall wasalso observed in Taranaki, Waikato, and Rotorua onthe 6th, for the first time in about 30 years.The most unusual precipitation event of the yearwas a coating of red Australian dust, sometimes 2
mm thick, which fell on parts of Northland, Auckland,Waikato, Bay of Plenty, and Taranaki on 25September.(iii) Notable eventsAt the start of <strong>2009</strong>, soil moisture levels were belownormal for much of the North Island (except Gisborneand northern Manawatu), as well as in the TasmanDistrict, northern Westland, north and south Canterbury,and south Otago. However, rainfall in lateFebruary returned soil moisture levels to near-normalstatus across much of the country. For regions in thenorth and east of the North Island, and eastern SouthIsland (Northland, Auckland, Coromandel, Bay ofPlenty, central North Island, Gisborne, Hawkes Bay,Otago, Canterbury, the Kaikoura coast), severe soilmoisture deficits had again developed by the endof the year, following an extremely windy and dryNovember and December period. Northland wasparticularly affected. The geographical pattern of significantsoil moisture deficits in northern and easternareas seen at the end of <strong>2009</strong> is a typical impact of ElNiño conditions for New Zealand.There were 15 flooding events in New Zealand in<strong>2009</strong>, slightly less than 2008. Major flooding occurredon 27 April on the West Coast. On that day, Mt. Cookrecorded 341 mm of rainfall (its highest April one-daytotal since records began in 1928), and torrential rainfell in Greymouth, where roads became impassableand homes were evacuated. Trampers were strandedin the Mueller Hut in Aoraki Mt. Cook NationalPark, and about 120 people were evacuated from theMilford Track by helicopter. Heavy rains also causedflooding on 16–20 May in the Canterbury and Otagoregions, when the Rangitata River burst its banks. On29 June, heavy rain resulted in landslips and roadclosures in the Manawatu–Wanganui region. Heavyrainfall in the Gisborne District on 29 and 30 June ledto flooding, evacuations, landslips, and the declarationof a Civil Defence Emergency.• Highest recorded air temperature: 38.0°C,Culverden (Canterbury), 8 February (Alsohighest February maximum temperature everrecorded at this location)• Lowest recorded air temperature: -11.7 ºC,Middlemarch (Central Otago), 19 July• Highest recorded wind gust: 184 km hr -1 ,Southwest Cape, Stewart Island, 4 November3) Southwest Pacific—A. Peltier and L. TahaniCountries considered in this section include:American Samoa, Cook Islands, Fiji, French Polynesia,Kiribati, Nauru, New Caledonia, Niue, PapuaNew Guinea, Samoa, Solomon Islands, Tokelau,Tonga, Tuvalu, and Vanuatu.(i) TemperaturesTemperatures were below the 1971–2000 averageat numerous stations in the equatorial Pacific duringthe austral summer, the result of the weakeningLa Niña event in the tropical Pacific. In contrast, anextended region of above-average air temperatureencompassed northern Papua New Guinea, NewCaledonia, Vanuatu, Fiji, Tonga, Southern CookIsland, and the Austral Islands with anomalies up to+1.8°C south of Rapa (150°W).With the development of El Niño in the australwinter, the temperature pattern reversed, withabove-average air temperatures near the equatorand relatively low temperatures over New Caledonia,Vanuatu, and Fiji. In general, temperatures were abovenormal in <strong>2009</strong> (Fig. 7.54; Table 7.3), largely due to theearly-year La Niña being relatively weak compared tothe subsequent moderate <strong>2009</strong>/10 El Niño.(ii) RainfallAnnual rainfall exceeded 120% of the 1979–95mean over parts of New Caledonia and Vanuatu (Fig.7.55; Table 7.4). Below-normal precipitation (< 80%)(iv) Significant statistics• Highest annual mean temperature:15.8°C, Whangarei (Northland)• Lowest annual mean temperature:7.3°C, Mt. Ruapehu (central NorthIsland)• Highest annual rainfall total: 10 956mm, Cropp River in the Hokitika Rivercatchment (West Coast)• Highest one-day rainfall: 341 mm,Mount Cook, 27 AprilFig. 7.54. Air temperature anomaly (1971–2000 base period)for the Southwest Pacific. (Source: NOAA NCEP CPCCAMS.)<strong>STATE</strong> <strong>OF</strong> <strong>THE</strong> <strong>CLIMATE</strong> <strong>IN</strong> <strong>2009</strong> juNE 2010 |S185
- Page 8 and 9:
Luo, Jing-Jia, Research Institute f
- Page 10 and 11:
Tedesco, Marco, Department Earth an
- Page 12 and 13:
4. THE TROPICS.....................
- Page 14 and 15:
ABSTRACT—M. O. Baringer, D. S. Ar
- Page 16 and 17:
I. INTRODUCTION—M. O. Baringer an
- Page 18 and 19:
Table 1.1 The GCOS Essential Climat
- Page 20 and 21:
S18 | juNE 2010
- Page 22 and 23:
Stratospheric TemperatureCloudiness
- Page 25:
Source Datasets Sectionhttp://www.p
- Page 28 and 29:
HOW do WE KNOW THE WORLD HAS WARMED
- Page 30 and 31:
Fig. 2.6. As for Fig. 2.1 but for l
- Page 32 and 33:
Fig. 2.10. Change in TCWV from 2008
- Page 34 and 35:
Precipitation anomalies in 2009, ov
- Page 36 and 37:
Fig. 2.18. Seasonal SCE anomalies (
- Page 38 and 39:
USING SI-TRACABLE GLOBAL POSITIONIN
- Page 40 and 41:
6) Lake levels—C. BirkettLake vol
- Page 42 and 43:
Fig. 2.30. (a) The daily AO index f
- Page 45 and 46:
(C) Carbon monoxide (CO)There has b
- Page 47 and 48:
Table 2.5. Mixing ratios, radiative
- Page 50 and 51:
the mid-1990s but has since levelle
- Page 52 and 53:
with all 42 glaciers observed retre
- Page 54 and 55:
of 0.1° and 5 days (Kaiser et al.
- Page 56 and 57:
Fig. 3.1. (a) Yearly mean SSTAs in
- Page 58 and 59:
(Fig. 3.3c). It is interesting that
- Page 60 and 61:
strong there, consistent with anoma
- Page 62 and 63:
cont'RECENT ADVANCES IN OUR UNDERST
- Page 64 and 65:
is to cause SST to rise if oceanic
- Page 66 and 67:
egions around the subtropical salin
- Page 68 and 69:
Fig 3.17. Principal empirical ortho
- Page 70 and 71:
Fig. 3.19. Daily estimates of the s
- Page 72 and 73:
Fig. 3.22. (top) The 2009 SSH anoma
- Page 74 and 75:
to update the CO 2climatology, ther
- Page 76 and 77:
µmol kg -1 or about half of the ac
- Page 78 and 79:
Fig. 3.31. (a) Average MODIS-Aqua C
- Page 80 and 81:
latitudes, chlorophyll and thermal
- Page 83 and 84:
Fig. 4.4. (a) Anomalous 850-hPa win
- Page 85 and 86:
(Fig. 4.6). These include four MJO
- Page 87 and 88:
Fig. 4.8. NOAA’s ACE index expres
- Page 89 and 90:
Fig. 4.14. ASO 2009: Anomalous 200-
- Page 91 and 92:
Fig. 4.17. The tracks of all TCs th
- Page 93 and 94:
Several previous studies have shown
- Page 95 and 96:
followed by TY Linfa and TS Nangka
- Page 97 and 98:
The Philippines were severely affec
- Page 99 and 100:
The historical SIO TC data is proba
- Page 101 and 102:
Fig. 4.26. Global anomalies of TCHP
- Page 103 and 104:
degree resolution NASA TRMM rainfal
- Page 105 and 106:
F i g. 4.32 . TRMM (a) mean and (b)
- Page 107 and 108:
THE forgotten sub-BASIN—THE centr
- Page 109 and 110:
5. THE ARCTIC—J. Richter-Menge, E
- Page 111 and 112:
and North America (south of 55° la
- Page 113 and 114:
Fig. 5.8. 2007-09 Atlantic water la
- Page 115 and 116:
d. Sea ice cover—D. Perovich, R.
- Page 117 and 118:
e. Land1) Vegetation—D. A. Walker
- Page 119 and 120:
Fig. 5.18. Total annual river disch
- Page 121 and 122:
negative SCD anomalies were evident
- Page 123 and 124:
with records beginning in 1873, the
- Page 125 and 126:
(QuikSCAT, 2000-09) microwave remot
- Page 127 and 128:
6. ANTARCTICAa. Overview—R. L. Fo
- Page 129 and 130:
(SCAR) report ‘Antarctic Climate
- Page 131 and 132:
these stations in April, August, an
- Page 133 and 134:
e. 2008-2009 Seasonal melt extent a
- Page 135 and 136: positive ice-season duration anomal
- Page 137 and 138: 7. REGIONAL CLIMATESa. Introduction
- Page 139 and 140: first half of the year (January-Jun
- Page 141 and 142: its second wettest such period. Sev
- Page 143 and 144: California began the year with mode
- Page 145 and 146: The first drought occurred in March
- Page 147 and 148: Fig. 7.8. (a) Annual mean temperatu
- Page 149 and 150: Fig. 7.11. (a) Annual mean temperat
- Page 151 and 152: EXTREME rainfall and the flood of t
- Page 153 and 154: Fig. 7.14. Composite for standardiz
- Page 155 and 156: Fig. 7.17. Daily maximum temperatur
- Page 157 and 158: (ii) PrecipitationDecember to Febru
- Page 159 and 160: For Zimbabwe, the rainfall season,
- Page 161 and 162: Fig. 7.28. Annual mean temperature
- Page 163 and 164: Fig. 7.31. Seasonal anomalies (1961
- Page 165 and 166: (1706-2009), and new national recor
- Page 167 and 168: cold in southern and central Finlan
- Page 169 and 170: EXCEPTIONAL storm strikes northern
- Page 171 and 172: 7.32b). April was particularly mild
- Page 173 and 174: to -44 о С) persisted in southern
- Page 175 and 176: Fig. 7.39. Weather conditions in De
- Page 177 and 178: on the 1971-2000 climatology) for a
- Page 179 and 180: excess rainfall, while 11 subdivisi
- Page 181 and 182: 4) Southwest Asia(i) Iraq—M. Roge
- Page 183 and 184: Wales. The warmth was particularly
- Page 185: The most significant severe thunder
- Page 189 and 190: and Vanua Levu islands (Fiji) as a
- Page 191 and 192: Table 7.5. Maximum temperature anom
- Page 193 and 194: 8. SEASONAL SUMMARIES—Mike Halper
- Page 195 and 196: Fig. 8.5. Jun-Aug 2009 (top) surfac
- Page 197 and 198: ACKNOWLEDGMENTSIn addition to the m
- Page 199 and 200: CFCCFC-11CFC-12CH 4Chl satCIIFENClC
- Page 201 and 202: OAFlux Objectively Analyzed Air-Sea
- Page 203 and 204: Ashok, K., S. K. Behera, S. A. Rao,
- Page 205 and 206: Cangialosi, J. P., and L. A. Avila,
- Page 207 and 208: Francis, J. A., W. Chan, D. J. Leat
- Page 209 and 210: Hudson, J. M. G., and G. H. R. Henr
- Page 211 and 212: Landsea, C. W., and W. M. Gray, 199
- Page 213 and 214: Meinen, C. S., M. O. Baringer, and
- Page 215 and 216: Ramaswamy, V., M. D. Schwarzkopf, W
- Page 217 and 218: ——, ——, T. C. Peterson, and
- Page 219 and 220: Wang, L., C. Derksen, and R. Brown,
- Page 224: Monthly average temperature anomali