


Create successful ePaper yourself
Turn your PDF publications into a flip-book with our unique Google optimized e-Paper software.
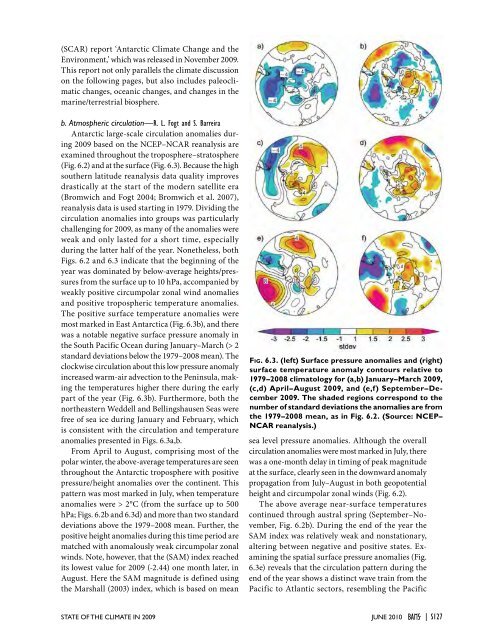
(SCAR) report ‘Antarctic Climate Change and theEnvironment,’ which was released in November <strong>2009</strong>.This report not only parallels the climate discussionon the following pages, but also includes paleoclimaticchanges, oceanic changes, and changes in themarine/terrestrial biosphere.b. Atmospheric circulation—R. L. Fogt and S. BarreiraAntarctic large-scale circulation anomalies during<strong>2009</strong> based on the NCEP–NCAR reanalysis areexamined throughout the troposphere–stratosphere(Fig. 6.2) and at the surface (Fig. 6.3). Because the highsouthern latitude reanalysis data quality improvesdrastically at the start of the modern satellite era(Bromwich and Fogt 2004; Bromwich et al. 2007),reanalysis data is used starting in 1979. Dividing thecirculation anomalies into groups was particularlychallenging for <strong>2009</strong>, as many of the anomalies wereweak and only lasted for a short time, especiallyduring the latter half of the year. Nonetheless, bothFigs. 6.2 and 6.3 indicate that the beginning of theyear was dominated by below-average heights/pressuresfrom the surface up to 10 hPa, accompanied byweakly positive circumpolar zonal wind anomaliesand positive tropospheric temperature anomalies.The positive surface temperature anomalies weremost marked in East Antarctica (Fig. 6.3b), and therewas a notable negative surface pressure anomaly inthe South Pacific Ocean during January–March (> 2standard deviations below the 1979–2008 mean). Theclockwise circulation about this low pressure anomalyincreased warm-air advection to the Peninsula, makingthe temperatures higher there during the earlypart of the year (Fig. 6.3b). Furthermore, both thenortheastern Weddell and Bellingshausen Seas werefree of sea ice during January and February, whichis consistent with the circulation and temperatureanomalies presented in Figs. 6.3a,b.From April to August, comprising most of thepolar winter, the above-average temperatures are seenthroughout the Antarctic troposphere with positivepressure/height anomalies over the continent. Thispattern was most marked in July, when temperatureanomalies were > 2°C (from the surface up to 500hPa; Figs. 6.2b and 6.3d) and more than two standarddeviations above the 1979–2008 mean. Further, thepositive height anomalies during this time period arematched with anomalously weak circumpolar zonalwinds. Note, however, that the (SAM) index reachedits lowest value for <strong>2009</strong> (-2.44) one month later, inAugust. Here the SAM magnitude is defined usingthe Marshall (2003) index, which is based on meanFig. 6.3. (left) Surface pressure anomalies and (right)surface temperature anomaly contours relative to1979–2008 climatology for (a,b) January–March <strong>2009</strong>,(c,d) April–August <strong>2009</strong>, and (e,f) September–December<strong>2009</strong>. The shaded regions correspond to thenumber of standard deviations the anomalies are fromthe 1979–2008 mean, as in Fig. 6.2. (Source: NCEP–NCAR reanalysis.)sea level pressure anomalies. Although the overallcirculation anomalies were most marked in July, therewas a one-month delay in timing of peak magnitudeat the surface, clearly seen in the downward anomalypropagation from July–August in both geopotentialheight and circumpolar zonal winds (Fig. 6.2).The above average near-surface temperaturescontinued through austral spring (September–November,Fig. 6.2b). During the end of the year theSAM index was relatively weak and nonstationary,altering between negative and positive states. Examiningthe spatial surface pressure anomalies (Fig.6.3e) reveals that the circulation pattern during theend of the year shows a distinct wave train from thePacific to Atlantic sectors, resembling the Pacific<strong>STATE</strong> <strong>OF</strong> <strong>THE</strong> <strong>CLIMATE</strong> <strong>IN</strong> <strong>2009</strong> juNE 2010 |S127


