Coastal Impacts, Adaptation, and Vulnerabilities - Climate ...
Coastal Impacts, Adaptation, and Vulnerabilities - Climate ...
Coastal Impacts, Adaptation, and Vulnerabilities - Climate ...

You also want an ePaper? Increase the reach of your titles
YUMPU automatically turns print PDFs into web optimized ePapers that Google loves.
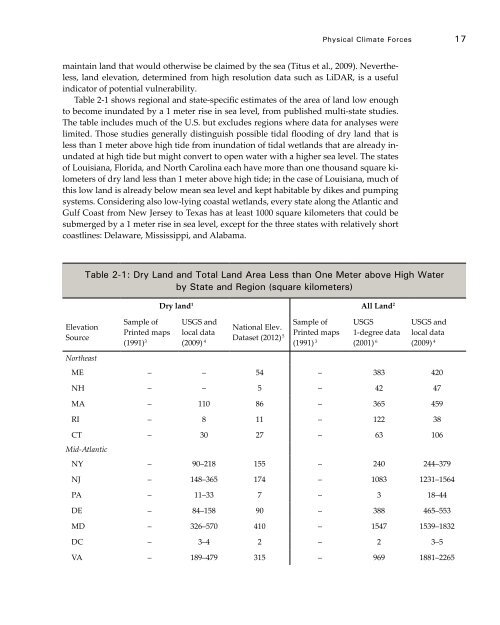
Physical <strong>Climate</strong> Forces 17maintain l<strong>and</strong> that would otherwise be claimed by the sea (Titus et al., 2009). Nevertheless,l<strong>and</strong> elevation, determined from high resolution data such as LiDAR, is a usefulindicator of potential vulnerability.Table 2-1 shows regional <strong>and</strong> state-specific estimates of the area of l<strong>and</strong> low enoughto become inundated by a 1 meter rise in sea level, from published multi-state studies.The table includes much of the U.S. but excludes regions where data for analyses werelimited. Those studies generally distinguish possible tidal flooding of dry l<strong>and</strong> that isless than 1 meter above high tide from inundation of tidal wetl<strong>and</strong>s that are already inundatedat high tide but might convert to open water with a higher sea level. The statesof Louisiana, Florida, <strong>and</strong> North Carolina each have more than one thous<strong>and</strong> square kilometersof dry l<strong>and</strong> less than 1 meter above high tide; in the case of Louisiana, much ofthis low l<strong>and</strong> is already below mean sea level <strong>and</strong> kept habitable by dikes <strong>and</strong> pumpingsystems. Considering also low-lying coastal wetl<strong>and</strong>s, every state along the Atlantic <strong>and</strong>Gulf Coast from New Jersey to Texas has at least 1000 square kilometers that could besubmerged by a 1 meter rise in sea level, except for the three states with relatively shortcoastlines: Delaware, Mississippi, <strong>and</strong> Alabama.Table 2-1: Dry L<strong>and</strong> <strong>and</strong> Total L<strong>and</strong> Area Less than One Meter above High Waterby State <strong>and</strong> Region (square kilometers)Dry l<strong>and</strong> 1 All L<strong>and</strong> 2ElevationSourceSample of USGS <strong>and</strong>National Elev.Printed maps local dataDataset (2012)(1991) 3 (2009) 54Sample of USGS USGS <strong>and</strong>(1991) 3 (2001) 6 (2009) 4Printed maps 1-degree data local dataNortheastME – – 54 – 383 420NH – – 5 – 42 47MA – 110 86 – 365 459RI – 8 11 – 122 38CT – 30 27 – 63 106Mid-AtlanticNY – 90–218 155 – 240 244–379NJ – 148–365 174 – 1083 1231–1564PA – 11–33 7 – 3 18–44DE – 84–158 90 – 388 465–553MD – 326–570 410 – 1547 1539–1832DC – 3–4 2 – 2 3–5VA – 189–479 315 – 969 1881–2265