Coastal Impacts, Adaptation, and Vulnerabilities - Climate ...
Coastal Impacts, Adaptation, and Vulnerabilities - Climate ...
Coastal Impacts, Adaptation, and Vulnerabilities - Climate ...

You also want an ePaper? Increase the reach of your titles
YUMPU automatically turns print PDFs into web optimized ePapers that Google loves.
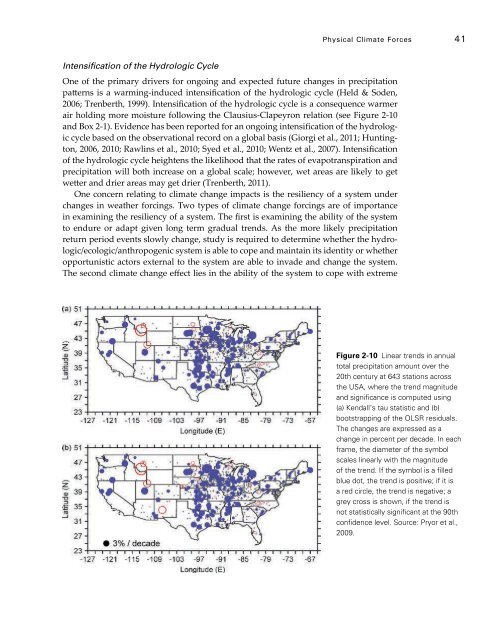
Physical <strong>Climate</strong> Forces 41Intensification of the Hydrologic CycleOne of the primary drivers for ongoing <strong>and</strong> expected future changes in precipitationpatterns is a warming-induced intensification of the hydrologic cycle (Held & Soden,2006; Trenberth, 1999). Intensification of the hydrologic cycle is a consequence warmerair holding more moisture following the Clausius-Clapeyron relation (see Figure 2-10<strong>and</strong> Box 2-1). Evidence has been reported for an ongoing intensification of the hydrologiccycle based on the observational record on a global basis (Giorgi et al., 2011; Huntington,2006, 2010; Rawlins et al., 2010; Syed et al., 2010; Wentz et al., 2007). Intensificationof the hydrologic cycle heightens the likelihood that the rates of evapotranspiration <strong>and</strong>precipitation will both increase on a global scale; however, wet areas are likely to getwetter <strong>and</strong> drier areas may get drier (Trenberth, 2011).One concern relating to climate change impacts is the resiliency of a system underchanges in weather forcings. Two types of climate change forcings are of importancein examining the resiliency of a system. The first is examining the ability of the systemto endure or adapt given long term gradual trends. As the more likely precipitationreturn period events slowly change, study is required to determine whether the hydrologic/ecologic/anthropogenicsystem is able to cope <strong>and</strong> maintain its identity or whetheropportunistic actors external to the system are able to invade <strong>and</strong> change the system.The second climate change effect lies in the ability of the system to cope with extremeFigure 2-10 Linear trends in annualtotal precipitation amount over the20th century at 643 stations acrossthe USA, where the trend magnitude<strong>and</strong> significance is computed using(a) Kendall’s tau statistic <strong>and</strong> (b)bootstrapping of the OLSR residuals.The changes are expressed as achange in percent per decade. In eachframe, the diameter of the symbolscales linearly with the magnitudeof the trend. If the symbol is a filledblue dot, the trend is positive; if it isa red circle, the trend is negative; agrey cross is shown, if the trend isnot statistically significant at the 90thconfidence level. Source: Pryor et al.,2009.