Prospectus re Admission to the Official List - Heritage Oil
Prospectus re Admission to the Official List - Heritage Oil
Prospectus re Admission to the Official List - Heritage Oil

You also want an ePaper? Increase the reach of your titles
YUMPU automatically turns print PDFs into web optimized ePapers that Google loves.
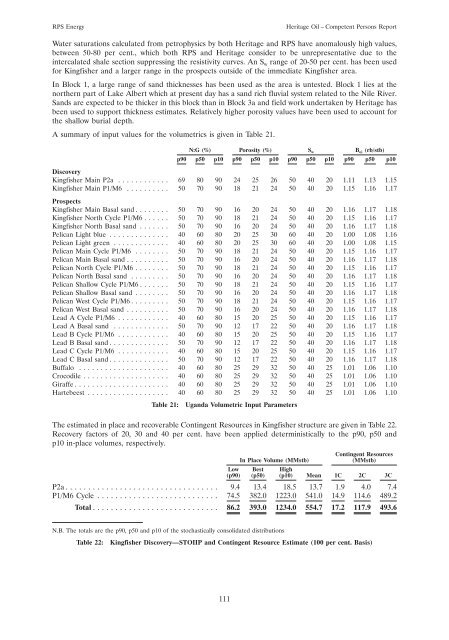
RPS Energy<strong>Heritage</strong> <strong>Oil</strong> – Competent Persons ReportWater saturations calculated from petrophysics by both <strong>Heritage</strong> and RPS have anomalously high values,between 50-80 per cent., which both RPS and <strong>Heritage</strong> consider <strong>to</strong> be un<strong>re</strong>p<strong>re</strong>sentative due <strong>to</strong> <strong>the</strong>intercalated shale section supp<strong>re</strong>ssing <strong>the</strong> <strong>re</strong>sistivity curves. An S w range of 20-50 per cent. has been usedfor Kingfisher and a larger range in <strong>the</strong> prospects outside of <strong>the</strong> immediate Kingfisher a<strong>re</strong>a.In Block 1, a large range of sand thicknesses has been used as <strong>the</strong> a<strong>re</strong>a is untested. Block 1 lies at <strong>the</strong>nor<strong>the</strong>rn part of Lake Albert which at p<strong>re</strong>sent day has a sand rich fluvial system <strong>re</strong>lated <strong>to</strong> <strong>the</strong> Nile River.Sands a<strong>re</strong> expected <strong>to</strong> be thicker in this block than in Block 3a and field work undertaken by <strong>Heritage</strong> hasbeen used <strong>to</strong> support thickness estimates. Relatively higher porosity values have been used <strong>to</strong> account for<strong>the</strong> shallow burial depth.A summary of input values for <strong>the</strong> volumetrics is given in Table 21.N:G (%) Porosity (%) S w B oi (rb/stb)p90 p50 p10 p90 p50 p10 p90 p50 p10 p90 p50 p10DiscoveryKingfisher Main P2a ............ 69 80 90 24 25 26 50 40 20 1.11 1.13 1.15Kingfisher Main P1/M6 .......... 50 70 90 18 21 24 50 40 20 1.15 1.16 1.17ProspectsKingfisher Main Basal sand ........ 50 70 90 16 20 24 50 40 20 1.16 1.17 1.18Kingfisher North Cycle P1/M6 ...... 50 70 90 18 21 24 50 40 20 1.15 1.16 1.17Kingfisher North Basal sand ....... 50 70 90 16 20 24 50 40 20 1.16 1.17 1.18Pelican Light blue .............. 40 60 80 20 25 30 60 40 20 1.00 1.08 1.16Pelican Light g<strong>re</strong>en ............. 40 60 80 20 25 30 60 40 20 1.00 1.08 1.15Pelican Main Cycle P1/M6 ........ 50 70 90 18 21 24 50 40 20 1.15 1.16 1.17Pelican Main Basal sand .......... 50 70 90 16 20 24 50 40 20 1.16 1.17 1.18Pelican North Cycle P1/M6 ........ 50 70 90 18 21 24 50 40 20 1.15 1.16 1.17Pelican North Basal sand ......... 50 70 90 16 20 24 50 40 20 1.16 1.17 1.18Pelican Shallow Cycle P1/M6 ....... 50 70 90 18 21 24 50 40 20 1.15 1.16 1.17Pelican Shallow Basal sand ........ 50 70 90 16 20 24 50 40 20 1.16 1.17 1.18Pelican West Cycle P1/M6 ......... 50 70 90 18 21 24 50 40 20 1.15 1.16 1.17Pelican West Basal sand .......... 50 70 90 16 20 24 50 40 20 1.16 1.17 1.18Lead A Cycle P1/M6 ............ 40 60 80 15 20 25 50 40 20 1.15 1.16 1.17Lead A Basal sand ............. 50 70 90 12 17 22 50 40 20 1.16 1.17 1.18Lead B Cycle P1/M6 ............ 40 60 80 15 20 25 50 40 20 1.15 1.16 1.17Lead B Basal sand .............. 50 70 90 12 17 22 50 40 20 1.16 1.17 1.18Lead C Cycle P1/M6 ............ 40 60 80 15 20 25 50 40 20 1.15 1.16 1.17Lead C Basal sand .............. 50 70 90 12 17 22 50 40 20 1.16 1.17 1.18Buffalo ..................... 40 60 80 25 29 32 50 40 25 1.01 1.06 1.10Crocodile .................... 40 60 80 25 29 32 50 40 25 1.01 1.06 1.10Giraffe ...................... 40 60 80 25 29 32 50 40 25 1.01 1.06 1.10Hartebeest ................... 40 60 80 25 29 32 50 40 25 1.01 1.06 1.10Table 21: Uganda Volumetric Input ParametersThe estimated in place and <strong>re</strong>coverable Contingent Resources in Kingfisher structu<strong>re</strong> a<strong>re</strong> given in Table 22.Recovery fac<strong>to</strong>rs of 20, 30 and 40 per cent. have been applied deterministically <strong>to</strong> <strong>the</strong> p90, p50 andp10 in-place volumes, <strong>re</strong>spectively.Contingent ResourcesIn Place Volume (MMstb)(MMstb)Low Best High(p90) (p50) (p10) Mean 1C 2C 3CP2a.................................. 9.4 13.4 18.5 13.7 1.9 4.0 7.4P1/M6 Cycle ........................... 74.5 382.0 1223.0 541.0 14.9 114.6 489.2Total ............................ 86.2 393.0 1234.0 554.7 17.2 117.9 493.6N.B. The <strong>to</strong>tals a<strong>re</strong> <strong>the</strong> p90, p50 and p10 of <strong>the</strong> s<strong>to</strong>chastically consolidated distributionsTable 22:Kingfisher Discovery—STOIIP and Contingent Resource Estimate (100 per cent. Basis)111