Prospectus re Admission to the Official List - Heritage Oil
Prospectus re Admission to the Official List - Heritage Oil
Prospectus re Admission to the Official List - Heritage Oil

You also want an ePaper? Increase the reach of your titles
YUMPU automatically turns print PDFs into web optimized ePapers that Google loves.
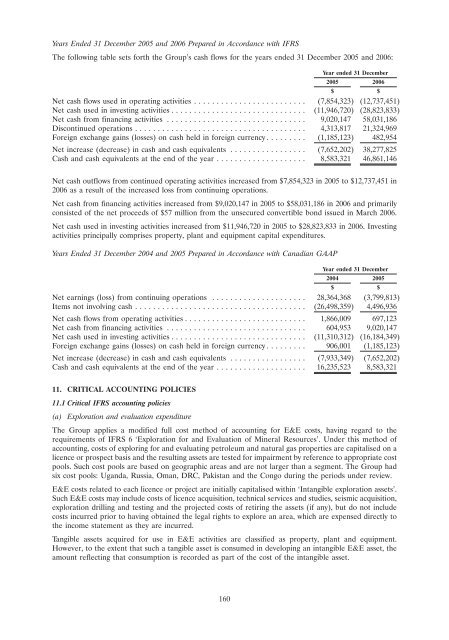
Years Ended 31 December 2005 and 2006 P<strong>re</strong>pa<strong>re</strong>d in Accordance with IFRSThe following table sets forth <strong>the</strong> Group’s cash flows for <strong>the</strong> years ended 31 December 2005 and 2006:Year ended 31 December2005 2006$ $Net cash flows used in operating activities ......................... (7,854,323) (12,737,451)Net cash used in investing activities .............................. (11,946,720) (28,823,833)Net cash from financing activities ............................... 9,020,147 58,031,186Discontinued operations ...................................... 4,313,817 21,324,969Fo<strong>re</strong>ign exchange gains (losses) on cash held in fo<strong>re</strong>ign cur<strong>re</strong>ncy ......... (1,185,123) 482,954Net inc<strong>re</strong>ase (dec<strong>re</strong>ase) in cash and cash equivalents ................. (7,652,202) 38,277,825Cash and cash equivalents at <strong>the</strong> end of <strong>the</strong> year .................... 8,583,321 46,861,146Net cash outflows from continued operating activities inc<strong>re</strong>ased from $7,854,323 in 2005 <strong>to</strong> $12,737,451 in2006 as a <strong>re</strong>sult of <strong>the</strong> inc<strong>re</strong>ased loss from continuing operations.Net cash from financing activities inc<strong>re</strong>ased from $9,020,147 in 2005 <strong>to</strong> $58,031,186 in 2006 and primarilyconsisted of <strong>the</strong> net proceeds of $57 million from <strong>the</strong> unsecu<strong>re</strong>d convertible bond issued in March 2006.Net cash used in investing activities inc<strong>re</strong>ased from $11,946,720 in 2005 <strong>to</strong> $28,823,833 in 2006. Investingactivities principally comprises property, plant and equipment capital expenditu<strong>re</strong>s.Years Ended 31 December 2004 and 2005 P<strong>re</strong>pa<strong>re</strong>d in Accordance with Canadian GAAPYear ended 31 December2004 2005$ $Net earnings (loss) from continuing operations ..................... 28,364,368 (3,799,813)Items not involving cash ...................................... (26,498,359) 4,496,936Net cash flows from operating activities ........................... 1,866,009 697,123Net cash from financing activities ............................... 604,953 9,020,147Net cash used in investing activities .............................. (11,310,312) (16,184,349)Fo<strong>re</strong>ign exchange gains (losses) on cash held in fo<strong>re</strong>ign cur<strong>re</strong>ncy ......... 906,001 (1,185,123)Net inc<strong>re</strong>ase (dec<strong>re</strong>ase) in cash and cash equivalents ................. (7,933,349) (7,652,202)Cash and cash equivalents at <strong>the</strong> end of <strong>the</strong> year .................... 16,235,523 8,583,32111. CRITICAL ACCOUNTING POLICIES11.1 Critical IFRS accounting policies(a) Exploration and evaluation expenditu<strong>re</strong>The Group applies a modified full cost method of accounting for E&E costs, having <strong>re</strong>gard <strong>to</strong> <strong>the</strong><strong>re</strong>qui<strong>re</strong>ments of IFRS 6 ‘Exploration for and Evaluation of Mineral Resources’. Under this method ofaccounting, costs of exploring for and evaluating petroleum and natural gas properties a<strong>re</strong> capitalised on alicence or prospect basis and <strong>the</strong> <strong>re</strong>sulting assets a<strong>re</strong> tested for impairment by <strong>re</strong>fe<strong>re</strong>nce <strong>to</strong> appropriate costpools. Such cost pools a<strong>re</strong> based on geographic a<strong>re</strong>as and a<strong>re</strong> not larger than a segment. The Group hadsix cost pools: Uganda, Russia, Oman, DRC, Pakistan and <strong>the</strong> Congo during <strong>the</strong> periods under <strong>re</strong>view.E&E costs <strong>re</strong>lated <strong>to</strong> each licence or project a<strong>re</strong> initially capitalised within ‘Intangible exploration assets’.Such E&E costs may include costs of licence acquisition, technical services and studies, seismic acquisition,exploration drilling and testing and <strong>the</strong> projected costs of <strong>re</strong>tiring <strong>the</strong> assets (if any), but do not includecosts incur<strong>re</strong>d prior <strong>to</strong> having obtained <strong>the</strong> legal rights <strong>to</strong> explo<strong>re</strong> an a<strong>re</strong>a, which a<strong>re</strong> expensed di<strong>re</strong>ctly <strong>to</strong><strong>the</strong> income statement as <strong>the</strong>y a<strong>re</strong> incur<strong>re</strong>d.Tangible assets acqui<strong>re</strong>d for use in E&E activities a<strong>re</strong> classified as property, plant and equipment.However, <strong>to</strong> <strong>the</strong> extent that such a tangible asset is consumed in developing an intangible E&E asset, <strong>the</strong>amount <strong>re</strong>flecting that consumption is <strong>re</strong>corded as part of <strong>the</strong> cost of <strong>the</strong> intangible asset.160