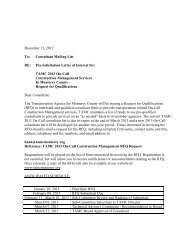
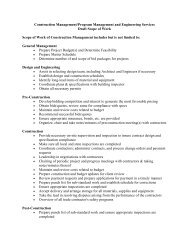
CALTRAIN EXTENSION TO MONTEREY COUNTYALTERNATIVES ANALYSISTable 4-2<strong>Commuter</strong> <strong>Rail</strong> Access to Employment in Santa Clara CountyRange 0.5 Mile 1.0 Mile 2.0 MilesID No. Station 2000 2025 2000 2025 2000 202515 Palo Alto 12,967 13,693 32,341 34,194 42,528 44,29614 California 4,292 4,741 16,156 17,515 43,678 46,76913 San Antonio 5,007 5,714 18,118 21,588 45,441 53,88212 Mountain View 8,276 9,813 19,705 23,532 39,483 47,23211 Sunnyvale 6,550 7,683 22,393 27,670 51,926 66,48210 Lawrence 8,224 10,093 35,258 41,327 72,673 84,9818 Santa Clara 8,201 10,300 22,350 28,102 99,643 117,4267 San Jose 7,736 10,401 38,030 52,196 75,682 104,0416 Tamien 2,430 2,990 9,488 11,294 24,527 29,0905 Capitol Expressway 1,422 1,725 4,155 5,108 12,018 14,5814 Blossom Hill 6,340 8,134 17,038 21,569 34,852 44,1013 Morgan Hill 1,029 1,713 4,251 7,438 9,132 23,6752 San Martin 163 97 511 545 1,286 3,3711 Gilroy 4,457 4,597 10,453 11,811 19,868 26,4229 Great America 2,710 3,069 19,207 23,276 63,905 78,275Station buffer totals 81,804 96,788 271,454 329,446 638,642 786,649Countywide 1,362,948 1,724,585 1,362,948 1,724,585 1,362,948 1,724,585Percent of county totals 6.0% 5.6% 19.9% 19.1% 46.9% 45.6%Station buffer totals without Great America 77,094 91,694 250,247 303,889 572,737 706,349Percent of county totals without Great America 5.7% 5.3% 18.4% 17.6% 42.0% 41.0%Source: Parsons645188AA-036Table 4-3Monterey County Commuting Trends (1990 and 2000)Commuting 1990 2000 Percent ChangeTotal population 355,660 401,762 +13.0Work in Monterey County 162,079 159,157 –1.8Live and work in Monterey County 151,520 146,444 –3.4Live elsewhere and work in Monterey County 10,559 12,713 +20.4Percent workforce commuting into Monterey County 7% 8% +14.3Live in Monterey County and work elsewhere 12,750 18,073 +41.7Santa Cruz County 6,821 7,601 +11.4Santa Clara County 2,411 5,799 +140.5San Benito County 601 1,187 +97.5San Luis Obispo County 329 540 +64.1Alameda County 246 533 +116.7San Mateo County 173 378 +118.5Fresno County 113 254 +124.8San Francisco County 120 220 +83.3Contra Costa County 83 155 +86.7Los Angeles County 295 134 –54.6Yuma County, Arizona 222 112 –49.5Outside U.S. 262 105 –59.9San Diego County 85 101 +18.8Other Locations 989 954 –3.5Source: U.S. Census645188AA-037parsons CHAPTER 4: TRAVEL DEMAND FORECASTS 103
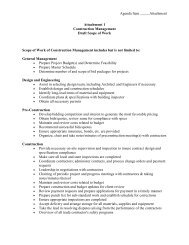
CALTRAIN EXTENSION TO MONTEREY COUNTYALTERNATIVES ANALYSISTable 4-4Monterey County <strong>Commuter</strong> ForecastsParsonsSan Benito Monterey Santa Cruz Santa Clara Other Bay Area Total <strong>Commuter</strong>s2000 2010 2020 2030 2000 2010 2020 2030 2000 2010 2020 2030 2000 2010 2020 2030 2000 2010 2020 2030 2000 2010 2020 20302003 1,187 1,583 1,978 2,374 146,444 169,803 191,365 209,963 7,601 11,402 13,302 14,252 5,799 12,267 14,051 15,390 1,401 3,002 3,402 3,402 165,912 201,356 228,454 248,111AMBAG2001 524 NA 851 NA 176,750 NA 233,901 NA 8,055 NA 14,418 NA 2,575 NA 5,999 NA 741 NA 1,149 NA 188,645 NA 256,318 NA2005 1,360 NA NA 2,933 125,006 NA NA 197,118 11,398 NA NA 13,997 6,747 NA NA 6,555 1,876 NA NA 4,546 146,387 NA NA 225,149MTC1998 745 1,005 1,201 NA 154,370 187,747 225,960 NA 10,774 11,936 14,687 NA 5,591 6,221 8,093 NA 1,269 1,293 1,799 NA 172,908 208,400 252,000 NA2000 455 600 914 NA 169,941 193,322 217,174 NA 8,547 10,998 17,254 NA 2,676 4,364 8,041 NA 570 863 1,739 NA 182,241 210,226 245,314 NA2004 1,187 1,417 1,663 2,213 146,298 175,035 217,393 245,911 7,593 10,954 12,330 14,652 5,799 9,570 9,705 12,468 1,401 1,979 2,130 2,938 162,509 199,222 243,536 278,601Sources:1. Parsons, 20032. AMBAG Four-County Travel Demand Model; AMBAG 2001. AMBAG 3+1 Regional Travel Demand Model; AMBAG June 2005.3. Metropolitan <strong>Transportation</strong> Commission, <strong>Commuter</strong> Forecasts for the San Francisco Bay Area 1990–2030, Data Summary, September 1998, October 2000, and May 2004.645188AA-038parsons CHAPTER 4: TRAVEL DEMAND FORECASTS 104