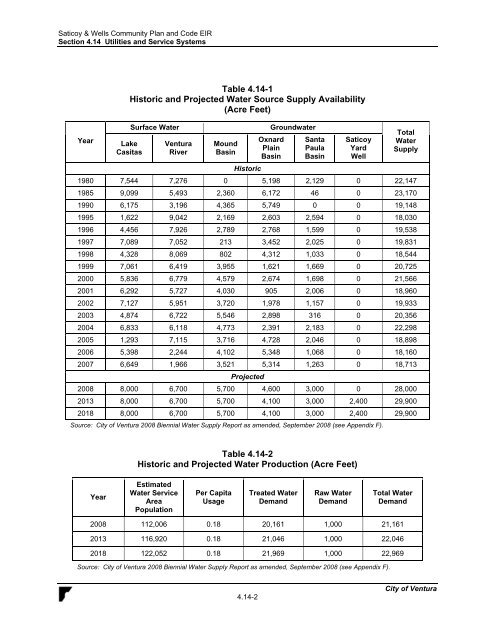
<strong>Saticoy</strong> & <strong>Wells</strong> <strong>Community</strong> <strong>Plan</strong> and Code EIRSection 4.14 Utilities and Service Systems4.14 UTILITIES and SERVICE SYSTEMSThis section discusses potential impacts to utilities, including water supply and distribution,wastewater collection and treatment, and energy resources.4.14.1 Settinga. Water Supply. <strong>City</strong> of <strong>Ventura</strong> water facilities include water treatment, reservoirs,wells, pump stations, and pipelines. The <strong>City</strong> provides drinking water to over 109,000 residentsthrough approximately 31,000 water service connections. The <strong>City</strong> receives its water from threesources: the <strong>Ventura</strong> River, Lake Casitas, and local groundwater wells. The <strong>City</strong> owns andoperates 11 wells, three water treatment plants, 23 pump stations, 31 reservoirs, and more than380 miles of distribution pipelines. A portion of <strong>Ventura</strong>’s water is taken from the <strong>Ventura</strong>River and is stored and pumped from four shallow wells. The <strong>City</strong> also receives water fromLake Casitas which is operated and treated by the Casitas Municipal Water District (CMWD).Groundwater wells are pumped in the <strong>City</strong>’s eastside to service the eastern portion of the <strong>City</strong>including the Project Area. Only <strong>City</strong>-generated water diverted from the <strong>Ventura</strong> River atFoster Park can be used to service the eastern area of the <strong>City</strong>.There are presently five water sources that provide water to the <strong>City</strong> water system.• Casitas Municipal Water District• <strong>Ventura</strong> River Surface Water Intake, Subsurface Water and <strong>Wells</strong> (Foster Park)• Mound Groundwater Basin• Oxnard Plain Groundwater Basin (Fox Canyon Aquifer)• Santa Paula Groundwater BasinThe <strong>City</strong> generally uses its water supplies in the following order: (1) <strong>Ventura</strong> River; (2) LakeCasitas; and (3) groundwater basins. Each of these water sources accounts for approximatelyone-third of the <strong>City</strong>’s entire water supply. Water is used in this order to maximize the amountof surface water that would otherwise be lost to runoff before using stored groundwater.Figure 4.14-1 shows the locations of the <strong>City</strong>’s water distribution facilities.Table 4.14-1 summarizes historic and projected water supply from these sources, as detailed inthe 2008 <strong>City</strong> of <strong>Ventura</strong> Urban Water Management <strong>Plan</strong>. The historic delivery values shownrepresent the capacity of available sources. The projected numbers in the table estimateavailable water supply levels under normal, non-drought conditions. Actual water supplylevels in any given year may be higher or lower than these averages.Table 4.14-2 presents historic and projected water production for the <strong>City</strong>. The <strong>City</strong> does notcurrently experience water supply shortages and, with the upcoming addition of the <strong>Saticoy</strong>Yard Well, does not anticipate the need for additional supplies within a 20-year horizon. The<strong>Saticoy</strong> Yard Well property has been acquired and construction is slated for 2010. The <strong>Saticoy</strong>Yard Well is anticipated to begin production in 2010, with an estimated 75% of designproduction capacity of 2,400 AFY.4.14-1<strong>City</strong> of <strong>Ventura</strong>
<strong>Saticoy</strong> & <strong>Wells</strong> <strong>Community</strong> <strong>Plan</strong> and Code EIRSection 4.14 Utilities and Service SystemsYearTable 4.14-1Historic and Projected Water Source Supply Availability(Acre Feet)LakeCasitasSurface Water<strong>Ventura</strong>RiverMoundBasinGroundwaterOxnardPlainBasinSantaPaulaBasin<strong>Saticoy</strong>YardWellTotalWaterSupplyHistoric1980 7,544 7,276 0 5,198 2,129 0 22,1471985 9,099 5,493 2,360 6,172 46 0 23,1701990 6,175 3,196 4,365 5,749 0 0 19,1481995 1,622 9,042 2,169 2,603 2,594 0 18,0301996 4,456 7,926 2,789 2,768 1,599 0 19,5381997 7,089 7,052 213 3,452 2,025 0 19,8311998 4,328 8,069 802 4,312 1,033 0 18,5441999 7,061 6,419 3,955 1,621 1,669 0 20,7252000 5,836 6,779 4,579 2,674 1,698 0 21,5662001 6,292 5,727 4,030 905 2,006 0 18,9602002 7,127 5,951 3,720 1,978 1,157 0 19,9332003 4,874 6,722 5,546 2,898 316 0 20,3562004 6,833 6,118 4,773 2,391 2,183 0 22,2982005 1,293 7,115 3,716 4,728 2,046 0 18,8982006 5,398 2,244 4,102 5,348 1,068 0 18,1602007 6,649 1,966 3,521 5,314 1,263 0 18,713Projected2008 8,000 6,700 5,700 4,600 3,000 0 28,0002013 8,000 6,700 5,700 4,100 3,000 2,400 29,9002018 8,000 6,700 5,700 4,100 3,000 2,400 29,900Source: <strong>City</strong> of <strong>Ventura</strong> 2008 Biennial Water Supply Report as amended, September 2008 (see Appendix F).Table 4.14-2Historic and Projected Water Production (Acre Feet)YearEstimatedWater ServiceAreaPopulationPer CapitaUsageTreated WaterDemandRaw WaterDemandTotal WaterDemand2008 112,006 0.18 20,161 1,000 21,1612013 116,920 0.18 21,046 1,000 22,0462018 122,052 0.18 21,969 1,000 22,969Source: <strong>City</strong> of <strong>Ventura</strong> 2008 Biennial Water Supply Report as amended, September 2008 (see Appendix F).4.14-2<strong>City</strong> of <strong>Ventura</strong>