Saticoy & Wells Community Plan & Development ... - City Of Ventura
Saticoy & Wells Community Plan & Development ... - City Of Ventura
Saticoy & Wells Community Plan & Development ... - City Of Ventura
Create successful ePaper yourself
Turn your PDF publications into a flip-book with our unique Google optimized e-Paper software.
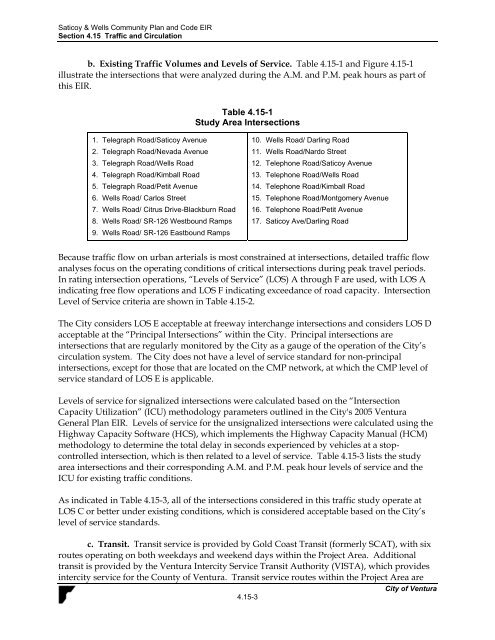
<strong>Saticoy</strong> & <strong>Wells</strong> <strong>Community</strong> <strong>Plan</strong> and Code EIRSection 4.15 Traffic and Circulationb. Existing Traffic Volumes and Levels of Service. Table 4.15-1 and Figure 4.15-1illustrate the intersections that were analyzed during the A.M. and P.M. peak hours as part ofthis EIR.Table 4.15-1Study Area Intersections1. Telegraph Road/<strong>Saticoy</strong> Avenue2. Telegraph Road/Nevada Avenue3. Telegraph Road/<strong>Wells</strong> Road4. Telegraph Road/Kimball Road5. Telegraph Road/Petit Avenue6. <strong>Wells</strong> Road/ Carlos Street7. <strong>Wells</strong> Road/ Citrus Drive-Blackburn Road8. <strong>Wells</strong> Road/ SR-126 Westbound Ramps9. <strong>Wells</strong> Road/ SR-126 Eastbound Ramps10. <strong>Wells</strong> Road/ Darling Road11. <strong>Wells</strong> Road/Nardo Street12. Telephone Road/<strong>Saticoy</strong> Avenue13. Telephone Road/<strong>Wells</strong> Road14. Telephone Road/Kimball Road15. Telephone Road/Montgomery Avenue16. Telephone Road/Petit Avenue17. <strong>Saticoy</strong> Ave/Darling RoadBecause traffic flow on urban arterials is most constrained at intersections, detailed traffic flowanalyses focus on the operating conditions of critical intersections during peak travel periods.In rating intersection operations, “Levels of Service” (LOS) A through F are used, with LOS Aindicating free flow operations and LOS F indicating exceedance of road capacity. IntersectionLevel of Service criteria are shown in Table 4.15-2.The <strong>City</strong> considers LOS E acceptable at freeway interchange intersections and considers LOS Dacceptable at the “Principal Intersections” within the <strong>City</strong>. Principal intersections areintersections that are regularly monitored by the <strong>City</strong> as a gauge of the operation of the <strong>City</strong>’scirculation system. The <strong>City</strong> does not have a level of service standard for non-principalintersections, except for those that are located on the CMP network, at which the CMP level ofservice standard of LOS E is applicable.Levels of service for signalized intersections were calculated based on the “IntersectionCapacity Utilization” (ICU) methodology parameters outlined in the <strong>City</strong>'s 2005 <strong>Ventura</strong>General <strong>Plan</strong> EIR. Levels of service for the unsignalized intersections were calculated using theHighway Capacity Software (HCS), which implements the Highway Capacity Manual (HCM)methodology to determine the total delay in seconds experienced by vehicles at a stopcontrolledintersection, which is then related to a level of service. Table 4.15-3 lists the studyarea intersections and their corresponding A.M. and P.M. peak hour levels of service and theICU for existing traffic conditions.As indicated in Table 4.15-3, all of the intersections considered in this traffic study operate atLOS C or better under existing conditions, which is considered acceptable based on the <strong>City</strong>’slevel of service standards.c. Transit. Transit service is provided by Gold Coast Transit (formerly SCAT), with sixroutes operating on both weekdays and weekend days within the Project Area. Additionaltransit is provided by the <strong>Ventura</strong> Intercity Service Transit Authority (VISTA), which providesintercity service for the County of <strong>Ventura</strong>. Transit service routes within the Project Area are<strong>City</strong> of <strong>Ventura</strong>4.15-3


