- Page 1 and 2: Stimulating investment in pearlfarm
- Page 3 and 4: Appendix IAppendix IIAppendix IIIAp
- Page 5 and 6: various project elements to describ
- Page 7 and 8: PNGSolomon IsPNGCook IsVanuatuFijiF
- Page 9 and 10: Figure 2. Typical coastal habitat f
- Page 11 and 12: to work alongside WorldFish science
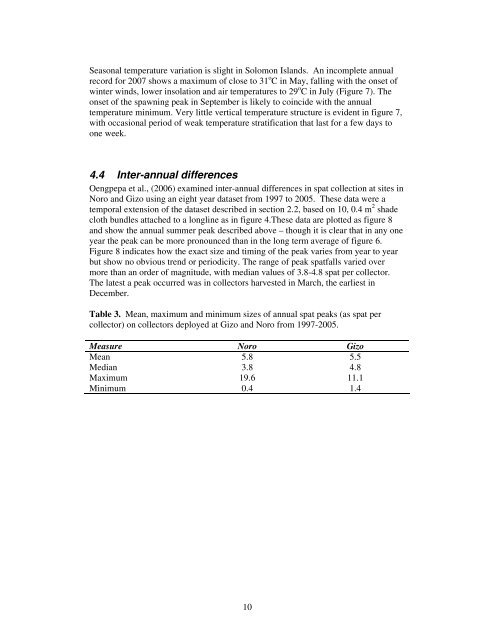
- Page 13 and 14: least two weeks before the main sur
- Page 15 and 16: duration of the dive, maximum botto
- Page 17 and 18: 3.7 Natural disastersEnvironmental
- Page 19 and 20: • Legislative review is underway
- Page 21 and 22: − Manning Strait islands− Suava
- Page 23 and 24: incentive treatment that fits the l
- Page 25 and 26: continuing to enter the market. Thi
- Page 27 and 28: Provisions for further aquaculture
- Page 29 and 30: • licences will relate to a parti
- Page 31 and 32: species in Australia are 5 - 10 tim
- Page 33 and 34: 6.3 Investor’s recommendations fo
- Page 35 and 36: Report on an EU project grant to th
- Page 37 and 38: Summary• Historically, the blackl
- Page 39 and 40: 1. IntroductionBlacklip pearl oyste
- Page 41 and 42: 3. Nationwide surveysIn May-June 20
- Page 43 and 44: 10 spat collectors were attached at
- Page 45 and 46: On a local scale, it was found that
- Page 47: 3025Normalised catch201510500 2 4 6
- Page 51 and 52: Figure 10. The number of Cymatium,
- Page 53 and 54: Figure 11. Intermediate culture tra
- Page 55 and 56: % survival10090HatcheryWild80706050
- Page 57 and 58: Thus, under the regime developed in
- Page 59 and 60: 7.3 Retention and mortality after s
- Page 61 and 62: 7.5 Seeding of hatchery-produced sp
- Page 63 and 64: have used average values of $25, $3
- Page 65 and 66: 9. ReferencesBraley, R.D. 1997. Fin
- Page 67 and 68: depend mainly on the quality of the
- Page 69 and 70: Report to:World Fish CenterSuitabil
- Page 71 and 72: Suitability of Habitats for Growth
- Page 73 and 74: Suitability of Habitats for Growth
- Page 75 and 76: Suitability of Habitats for Growth
- Page 77 and 78: Suitability of Habitats for Growth
- Page 79 and 80: Suitability of Habitats for Growth
- Page 81 and 82: Suitability of Habitats for Growth
- Page 83 and 84: Suitability of Habitats for Growth
- Page 85 and 86: Suitability of Habitats for Growth
- Page 87 and 88: Suitability of Habitats for Growth
- Page 89: Suitability of Habitats for Growth
- Page 92 and 93: Suitability of Habitats for Growth
- Page 94 and 95: Suitability of Habitats for Growth
- Page 96 and 97: Suitability of Habitats for Growth
- Page 98 and 99:
Suitability of Habitats for Growth
- Page 100 and 101:
Suitability of Habitats for Growth
- Page 102 and 103:
Suitability of Habitats for Growth
- Page 104 and 105:
Suitability of Habitats for Growth
- Page 106 and 107:
Suitability of Habitats for Growth
- Page 108 and 109:
Suitability of Habitats for Growth
- Page 110 and 111:
Suitability of Habitats for Growth
- Page 112 and 113:
Suitability of Habitats for Growth
- Page 114 and 115:
Suitability of Habitats for Growth
- Page 116 and 117:
Suitability of Habitats for Growth
- Page 118 and 119:
Suitability of Habitats for Growth
- Page 120 and 121:
Report to:World Fish CenterWater Te
- Page 122 and 123:
Water Temperature and Cyclone Frequ
- Page 124 and 125:
Water Temperature and Cyclone Frequ
- Page 126 and 127:
Water Temperature and Cyclone Frequ
- Page 128 and 129:
Water Temperature and Cyclone Frequ
- Page 130 and 131:
Water Temperature and Cyclone Frequ
- Page 132 and 133:
Water Temperature and Cyclone Frequ
- Page 134 and 135:
Water Temperature and Cyclone Frequ
- Page 136 and 137:
Water Temperature and Cyclone Frequ
- Page 138 and 139:
Water Temperature and Cyclone Frequ
- Page 140 and 141:
Water Temperature and Cyclone Frequ
- Page 142 and 143:
Water Temperature and Cyclone Frequ
- Page 144 and 145:
Water Temperature and Cyclone Frequ
- Page 146 and 147:
Water Temperature and Cyclone Frequ
- Page 148 and 149:
Water Temperature and Cyclone Frequ
- Page 150 and 151:
Water Temperature and Cyclone Frequ
- Page 152 and 153:
Water Temperature and Cyclone Frequ
- Page 154 and 155:
Water Temperature and Cyclone Frequ
- Page 156 and 157:
Water Temperature and Cyclone Frequ
- Page 158 and 159:
Water Temperature and Cyclone Frequ
- Page 160 and 161:
Water Temperature and Cyclone Frequ
- Page 162 and 163:
Water Temperature and Cyclone Frequ
- Page 164 and 165:
Water Temperature and Cyclone Frequ
- Page 166 and 167:
Water Temperature and Cyclone Frequ
- Page 168 and 169:
Water Temperature and Cyclone Frequ
- Page 170 and 171:
Water Temperature and Cyclone Frequ
- Page 172 and 173:
Report to:WorldFish CenterAbundance
- Page 174 and 175:
Abundance, Size Structure and Quali
- Page 176 and 177:
Abundance, Size Structure and Quali
- Page 178 and 179:
Abundance, Size Structure and Quali
- Page 180 and 181:
Abundance, Size Structure and Quali
- Page 182 and 183:
Abundance, Size Structure and Quali
- Page 184 and 185:
Abundance, Size Structure and Quali
- Page 186 and 187:
Abundance, Size Structure and Quali
- Page 188 and 189:
Abundance, Size Structure and Quali
- Page 190 and 191:
Abundance, Size Structure and Quali
- Page 192 and 193:
Abundance, Size Structure and Quali
- Page 194 and 195:
Abundance, Size Structure and Quali
- Page 196 and 197:
Abundance, Size Structure and Quali
- Page 198 and 199:
Abundance, Size Structure and Quali
- Page 200 and 201:
Abundance, Size Structure and Quali
- Page 202 and 203:
Abundance, Size Structure and Quali
- Page 204 and 205:
Abundance, Size Structure and Quali
- Page 206 and 207:
Abundance, Size Structure and Quali
- Page 208 and 209:
Abundance, Size Structure and Quali
- Page 210 and 211:
Abundance, Size Structure and Quali
- Page 212 and 213:
Abundance, Size Structure and Quali
- Page 214 and 215:
Abundance, Size Structure and Quali
- Page 216 and 217:
Abundance, Size Structure and Quali
- Page 218 and 219:
Abundance, Size Structure and Quali
- Page 220 and 221:
Abundance, Size Structure and Quali
- Page 222 and 223:
Report on an EU project grant to th
- Page 224 and 225:
1. Governance and political stabili
- Page 226 and 227:
Despite its present weaknesses, eff
- Page 228 and 229:
payments, but the authorities have
- Page 230 and 231:
to recede and presumably vanish und
- Page 232 and 233:
outcome is far from certain. There
- Page 234 and 235:
existing links, at locations within
- Page 236 and 237:
6. Forms of co-investment6.1 Partne
- Page 238 and 239:
8. Taxation and incentives8.1 Direc
- Page 240 and 241:
10. Labour laws10.1 Foreign workers
- Page 242 and 243:
GILLETT, PRESTON AND ASSOCIATES INC
- Page 244 and 245:
Page 21. EXECUTIVE SUMMARYPearl far
- Page 246 and 247:
Page 42. BACKGROUNDPast research su
- Page 248 and 249:
Page 6million; in 2002, it exported
- Page 250 and 251:
Page 8the bead in an even, uniform
- Page 252 and 253:
Page 10alternative products. Most m
- Page 254 and 255:
Page 12fisheries-related activities
- Page 256 and 257:
Page 144.3. PolicyThe current gover
- Page 258 and 259:
5.2. Stocking densityPage 16Mature
- Page 260 and 261:
Page 18or harmful fouling organisms
- Page 262 and 263:
Page 20In addition to licensing und
- Page 264 and 265:
Page 22Much of this work will have
- Page 266 and 267:
Page 24provide them with technical
- Page 268 and 269:
Page 26management, disease control,
- Page 270 and 271:
Page 28Ministry of Development Plan
- Page 272 and 273:
Page 30‘seeding’ means the impl
- Page 274 and 275:
Page 326. Provision of statistical
- Page 276 and 277:
Page 3414. Aggrieved person may app
- Page 278 and 279:
Page 36Division V. Importation, mov
- Page 280 and 281:
Page 38(2) Separate fees are payabl
- Page 282 and 283:
Page 40Other forms of government su
- Page 284 and 285:
Page 42Solomon IslandsPEARL FARMING