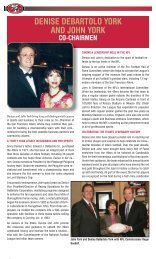
ALL-TIME RESULTSYEAR-BY-YEAR STATS1986 (10-5-1/10-6-1)NFC West ChampionsBill Walsh, CoachW 31 at Tampa Bay (50,780)/S-7 7L 13 at Los Angeles Rams (65,195)/S-14 16W 26 New Orleans (58,297)/S-21 17W 31 at Miami (70,264)/S-28 17W 35 Indianapolis (57,252)/O-5 14L 24 Minnesota (58,637)/O-12 (OT) 27T 10 at Atlanta (55,306)/O-19 (OT) 10W 31 at G.B. in Milwaukee (50,557)/O-26 17L 10 at New Orleans (52,234)/N-2 23W 43 St. Louis (59,172)/N-9 17L 6 at Washington (54,774)-MN/N-17 14W 20 Atlanta (58,747)/N-23 0L 17 New York Giants (59,777)-MN/D-1 21W 24 New York Jets (58,091)/D-7 10W 29 at New England (60,787)/D-14 24W 24 Los Angeles Rams (60,266)-FN/D-19 14374 247NFC PLAYOFF - JAN. 4(at Meadowlands, N.J. - Giants Stadium)L 3 New York Giants (76,034) 49TEAM STATISTICS 49ers OppTOTAL FIRST DOWNS 346 285By Rushing 114 97By Passing 213 169By Penalties 19 19TOTAL YARDS GAINED 6082 4880By Rushing 1986 1555By Passing 4096 3325TOTAL PLAYS FROM SCRIMMAGE 1118 1061Rushes 510 406Average Gain Per Rush 3.9 3.8NET YARDS PASSING 4096 3325Passes Attempted 582 604Passes Completed 353 324Percent Completed 60.7 53.6Had Intercepted 20 39Times Sacked 26 51Lost Attempting to Pass 203 448PUNTS 85 91Total Yardage of Punts 3450 3765Average Length 40.6 41.4KICKOFF RETURNS 42 71Total Yards Returned 757 1598Average Length of Return 18.0 22.5PENALTIES 95 89Yards Penalized 691 653FUMBLES 32 31Own Fumbles Recovered 23 21Opponents’ Fumbles Recovered 10 9FIELD GOALS 25 15Field Goals Attempted 35 25TOTAL POINTS SCORED 374 235Touchdowns Scored 43 29Touchdowns Rushing 16 8Touchdowns Passing 21 18Touchdown Returns 6 1Extra Points 41 28Safeties 0 0AVG. TIME OF POSSESSION 30:28 29:32SCORING TDs Ru Pa Int Fu KO Pu PAT FG S PtsWersching, Ray 0 0 0 0 0 0 0 42/41 35/25 0 116Rice, Jerry 16 1 15 0 0 0 0 0/0 0/0 0 96Craig, Roger 7 7 0 0 0 0 0 0/0 0/0 0 42Cribbs, Joe 5 5 0 0 0 0 0 0/0 0/0 0 30Clark, Dwight 2 0 2 0 0 0 0 0/0 0/0 0 12Frank, John 2 0 2 0 0 0 0 0/0 0/0 0 12Holmoe, Tom 2 0 0 2 0 0 0 0/0 0/0 0 12Francis, Russ 1 0 1 0 0 0 0 0/0 0/0 0 6Griffin, Don 1 0 0 0 0 0 1 0/0 0/0 0 6Harmon, Derrick 1 1 0 0 0 0 0 0/0 0/0 0 6Lott, Ronnie 1 0 0 1 0 0 0 0/0 0/0 0 6McKyer, Tim 1 0 0 1 0 0 0 0/0 0/0 0 6Moroski, Mike 1 1 0 0 0 0 0 0/0 0/0 0 6Nixon, Tory 1 0 0 1 0 0 0 0/0 0/0 0 6SAN FRANCISCO 49ERS \\295(continued)SCORING TDs Ru Pa Int Fu KO Pu PAT FG S PtsRathman, Tom 1 1 0 0 0 0 0 0/0 0/0 0 6Wilson, Mike 1 0 1 0 0 0 0 0/0 0/0 0 649ERS 43 16 21 5 0 0 1 42/41 35/25 0 374OPPONENTS* 27 8 18 0 0 1 1** 29/28 25/15 0 235*ret. blkd FGA **rcvrd blkd puntRUSHING Att Yds Avg LG TDCraig, Roger 204 830 4.1 25 7Cribbs, Joe 152 590 3.9 19 5Rathman, Tom 33 138 4.2 29t 1Tyler, Wendell 31 127 4.1 14 0Harmon, Derrick 27 77 2.9 15 1Rice, Jerry 10 72 7.2 18 1Kemp, Jeff 15 49 3.3 12 0Cherry, Tony 11 42 3.8 10 0Montana, Joe 17 38 2.2 17 0Moroski, Mike 6 22 3.7 12 1Ring, Bill 3 4 1.3 4 0Frank, John 1 -3 -3.0 -3 049ERS 510 1986 3.9 29t 16OPPONENTS 406 1555 3.8 36 8RECEIVING No Yds Avg LG TDRice, Jerry 86 1570 18.3 66t 15Craig, Roger 81 624 7.7 48 0Clark, Dwight 61 794 13.0 45t 2Francis, Russ 41 505 12.3 52 1Cribbs, Joe 35 346 9.9 33 0Rathman, Tom 13 121 9.3 14 0Wilson, Mike 9 104 11.6 18 1Frank, John 9 61 6.8 17 2Harmon, Derrick 8 78 9.8 15 0Crawford, Derrick 5 70 14.0 42 0Margerum, Ken 2 12 6.0 6 0Monroe, Carl 2 6 3.0 5 0Ring, Bill 1 8 8.0 8 049ERS 353 4299 12.2 66t 21OPPONENTS 324 3773 11.7 84t 18INTERCEPTIONS No Yds Avg LG TDLott, Ronnie 10 134 13.4 57t 1McKyer, Tim 6 33 5.5 21t 1Fahnhorst, Jim 4 52 13.0 46 0Fuller, Jeff 4 44 11.0 26 0Holmoe, Tom 3 149 49.7 78t 2Williamson, Carlton 3 3 1.0 2 0Griffin, Don 3 0 0.0 0 0Nixon, Tory 2 106 53.0 88t 1Tuiasosopo, Manu 1 22 22.0 22 0Cousineau, Tom 1 18 18.0 18 0Turner, Keena 1 9 9.0 9 0Haley, Charles 1 8 8.0 8 049ERS 39 578 14.8 88t 5OPPONENTS 20 205 10.3 57 0KICKOFF RETURNS No Yds Avg LG TDCrawford, Derrick 15 280 18.7 34 0Monroe, Carl 8 139 17.4 25 0Griffin, Don 5 97 19.4 28 0Harmon, Derrick 4 82 20.5 28 0Rathman, Tom 3 66 22.0 22 0Cherry, Tony 2 29 14.5 17 0Frank, John 2 24 12.0 16 0McKyer, Tim 1 15 15.0 15 0Ring, Bill 1 15 15.0 15 0Wilson, Mike 1 10 10.0 10 049ERS 42 757 18.0 34 0OPPONENTS 71 1598 22.5 101t 1PUNT RETURNS No FC Yds Avg LG TDGriffin, Don 38 18 377 9.9 76t 1Crawford, Derrick 4 0 15 3.8 9 0McKyer, Tim 1 1 5 5.0 5 049ERS 43 19 397 9.2 76t 1OPPONENTS 49 12 373 7.6 39 1PUNTING No Yds Avg TB I-20 LG BlkRunager, Max 83 3450 41.6 8 23 62 249ERS 85 3450 40.6 8 23 62 2OPPONENTS 91 3765 41.4 9 20 73 0PASSING Att Comp Pct Yds LG TD Int QBMontana, Joe 307 191 62.2 2236 48 8 9 80.7Kemp, Jeff 200 119 59.5 1554 66t 11 8 85.7Moroski, Mike 73 42 57.5 493 52t 2 3 70.2Rice, Jerry 2 1 50.0 16 16t 0 0 77.149ERS 582 353 60.7 4299 66t 21 20 81.1OPPONENTS 604 324 53.6 3773 84t 18 39 55.8// MEDIA GUIDE
ALL-TIME RESULTSYEAR-BY-YEAR STATS1987 (13-2/13-3)NFC West ChampionsBill Walsh, CoachL 17 at Pittsburgh (55,735)/S-13 30W 27 at Cincinnati (53,498)/S-20 26*Philadelphia/S-27W 41 at New York Giants (16,471)-MN/O-5 21W 25 at Atlanta (8,684)/O-11 17W 34 St. Louis (38,094)/O-18 28W 24 at New Orleans (60,497)/O-25 22W 31 at Los Angeles Rams (55,328)/N-1 10W 27 Houston (59,740)/N-8 20L 24 New Orleans (60,436)/N-15 26W 24 at Tampa Bay (63,211)/N-22 10W 38 Cleveland (60,243)-SUN/N-29 24W 23 at Green Bay (51,118)/D-6 12W 41 Chicago (63,509)-MN/D-14 0W 35 Atlanta (54,698)/D-20 7W 48 Los Angeles Rams (57,953)-SUN/D-27 0459 253NFC PLAYOFF -JAN. 9(at San Francisco - Candlestick Park)L 24 Minnesota (62,547)-SA 36* Game canceled due to <strong>NFL</strong> players’ strike.TEAM STATISTICS 49ers OppTOTAL FIRST DOWNS 357 250By Rushing 134 95By Passing 202 132By Penalties 21 23TOTAL YARDS GAINED 5987 4095By Rushing 2237 1611By Passing 3750 2484TOTAL PLAYS FROM SCRIMMAGE 1054 933Rushes 524 429Average Gain Per Rush 4.3 3.8NET YARDS PASSING 3750 2484Passes Attempted 501 467Passes Completed 322 224Percent Completed 64.3 48.0Had Intercepted 14 25Times Sacked 29 37Lost Attempting to Pass 205 287PUNTS 68 72Total Yardage of Punts 2541 2850Average Length 37.4 39.6KICKOFF RETURNS 55 76Total Yards Returned 1144 1598Average Length of Return 20.8 21.0PENALTIES 88 80Yards Penalized 792 660FUMBLES 25 30Own Fumbles Recovered 13 17Opponents’ Fumbles Recovered 13 12FIELD GOALS 16 24Field Goals Attempted 23 35TOTAL POINTS SCORED 459 253Touchdowns Scored 59 26Touchdowns Rushing 11 8Touchdowns Passing 44 13Touchdown Returns 4 5Extra Points 55 25Safeties 1 0AVG. TIME OF POSSESSION 31:43 28:17SCORING TDs Ru Pa Int Fu KO Pu PAT FG S PtsRice, Jerry 23 1 22 0 0 0 0 0/0 0/0 0 138Wersching, Ray 0 0 0 0 0 0 0 46/44 17/13 0 83Clark, Dwight 5 0 5 0 0 0 0 0/0 0/0 0 30Wilson, Mike 5 0 5 0 0 0 0 0/0 0/0 0 30Craig, Roger 4 3 1 0 0 0 0 0/0 0/0 0 24Rathman, Tom 4 1 3 0 0 0 0 0/0 0/0 0 24Brockhaus, Jeff 0 0 0 0 0 0 0 13/11 6/3 0 20Frank, John 3 0 3 0 0 0 0 0/0 0/0 0 18Heller, Ron 3 0 3 0 0 0 0 0/0 0/0 0 18Cribbs, Joe 2 1 0 0 0 1 0 0/0 0/0 0 12Cherry, Tony 1 1 0 0 0 0 0 0/0 0/0 0 6Greer, Terry 1 0 1 0 0 0 0 0/0 0/0 0 6McLemore, Dana 1 0 0 0 0 0 1 0/0 0/0 0 6Monroe, Carl 1 0 1 0 0 0 0 0/0 0/0 0 6Montana, Joe 1 1 0 0 0 0 0 0/0 0/0 0 6Rodgers, Del 1 1 0 0 0 0 0 0/0 0/0 0 6Stevens, Mark 1 1 0 0 0 0 0 0/0 0/0 0 6Taylor, John 1 0 0 0 1 0 0 0/0 0/0 0 6Wells, Mike 1 0 0 0 0 0 1* 0/0 0/0 0 6Young, Steve 1 1 0 0 0 0 0 0/0 0/0 0 6Fuller, Jeff 0 0 0 0 0 0 0 0/0 0/0 1 249ERS 59 11 44 0 1 1 2 59/55 23/16 1 459OPPONENTS# 26 8 13 0 3 0 1* 26/25 35/24 0 253*ret blkd punt **ret blkd FGA #rcvrd blkd puntSAN FRANCISCO 49ERS \\296RUSHING Att Yds Avg LG TDCraig, Roger 215 815 3.8 25 3Cribbs, Joe 70 300 4.3 20 1Rathman, Tom 62 257 4.2 35 1Young, Steve 26 190 7.3 29t 1Montana, Joe 35 141 4.0 20 1Sydney, Harry 29 125 4.3 15 0Varajon, Mike 18 82 4.6 11 0Cherry, Tony 13 65 5.0 16 1Rice, Jerry 8 51 6.4 17 1Hardy, Andre 7 48 6.9 14 0Rodgers, Del 11 46 4.2 15 1Stevens, Mark 10 45 4.5 16 1DuBose, Doug 10 33 3.3 11 0Monroe, Carl 2 26 13.0 17 0Flagler, Terrence 6 11 1.8 5 0Frank, John 1 2 2.0 2 0Blount, Ed 1 0 0.0 0 049ERS 524 2237 4.3 35 11OPPONENTS 429 1611 3.8 57 8RECEIVING No Yds Avg LG TDCraig, Roger 66 492 7.5 35t 1Rice, Jerry 65 1078 16.6 57t 22Rathman, Tom 30 329 11.0 29 3Wilson, Mike 29 450 15.5 46t 5Frank, John 26 296 11.4 27 3Clark, Dwight 24 290 12.1 40t 5Francis, Russ 22 202 9.2 19 0Heller, Ron 12 165 13.8 39t 3Taylor, John 9 151 16.8 34 0Cribbs, Joe 9 70 7.8 16 0Greer, Terry 6 111 18.5 50 1Gladney, Tony 4 60 15.0 19 0DuBose, Doug 4 37 9.3 14 0Monroe, Carl 3 66 22.0 39t 1Varajon, Mike 3 25 8.3 12 0Rodgers, Del 2 45 22.5 24 0Jones, Brent 2 35 17.5 22 0Flagler, Terrence 2 28 14.0 24 0Dressel, Chris 1 8 8.0 8 0Hardy, Andre 1 7 7.0 7 0Margerum, Ken 1 7 7.0 7 0Sydney, Harry 1 3 3.0 3 049ERS 322 3955 12.3 57t 44OPPONENTS 224 2771 12.4 63t 13INTERCEPTIONS No Yds Avg LG TDLott, Ronnie 5 62 12.4 34 0Griffin, Don 5 1 0.2 1 0McLemore, Dana 2 35 17.5 25 0McKyer, Tim 2 0 0.0 0 0Courtney, Matt 1 30 30.0 30 0Williamson, Carlton 1 17 17.0 17 0Walter, Mike 1 16 16.0 16 0Turner, Keena 1 15 15.0 15 0Martin, Derrick 1 12 12.0 12 0Cousineau, Tom 1 11 11.0 11 0Nixon, Tory 1 5 5.0 5 0Shell, Todd 1 1 1.0 1 0Fahnhorst, Jim 1 0 0.0 0 0Holmoe, Tom 1 0 0.0 0 0McColl, Milt 1 0 0.0 0 049ERS 25 205 8.2 34 0OPPONENTS 14 258 18.4 38 0KICKOFF RETURNS No Yds Avg LG TDRodgers, Del 17 358 21.1 50 0Cribbs, Joe 13 327 25.2 92t 1Sydney, Harry 12 243 20.3 30 0Monroe, Carl 5 91 18.2 24 0Flagler, Terrence 3 31 10.3 16 0Rathman, Tom 2 37 18.5 21 0McLemore,Dana 1 23 23.0 23 0Henley, Thomas 1 21 21.0 21 0Varajon, Mike 1 13 13.0 13 049ERS 55 1144 20.8 92t 1OPPONENTS 76 1598 21.0 97t 1PUNT RETURNS No FC Yds Avg LG TDMcLemore, Dana 21 7 265 12.6 83t 1Griffin, Don 9 2 79 8.8 29 0Martin, Derrick 2 0 12 6.0 9 0Pollard, Darryl 1 0 0 0.0 0 0Taylor, John 1 0 9 9.0 9 049ERS 34 9 365 10.7 83t 1OPPONENTS 29 10 195 6.7 26 1PUNTING No Yds Avg TB I-20 LG BlkRunager, Max 55 2157 39.2 7 13 56 1Asmus, Jim 12 384 32.0 1 3 51 049ERS 67 2541 37.4 8 16 56 1OPPONENTS 72 2850 39.6 6 13 68 1PASSING Att Comp Pct Yds LG TD Int QBMontana, Joe 398 266 66.8 3054 57t 31 13 102.1Young, Steve 69 37 53.6 570 50t 10 0 120.8Gagliano, Bob 29 16 55.2 229 50 1 1 78.1Stevens, Mark 4 2 50.0 52 39t 1 0 135.4Sydney, Harry 1 1 100.0 50 50t 1 0 158.349ERS 501 322 64.3 3955 57t 44 14 106.2OPPONENTS 467 224 48.0 2771 63t 13 25 53.8// MEDIA GUIDE
- Page 2 and 3:
2011 SAN FRANCISCO 49ERS SCHEDULE &
- Page 4 and 5:
OFFICE OF THE OWNERDenise DeBartolo
- Page 6 and 7:
CO-CHAIRMENDENISE & JOHN YORKIn rec
- Page 8 and 9:
Trent Baalke enters his seventh sea
- Page 10 and 11:
Jeff Ferguson is in his sixth year
- Page 12 and 13:
Attack each day with an enthusiasm
- Page 14 and 15:
ALL-TIME 49ERS HEAD COACHING RECORD
- Page 16 and 17:
Greg Roman is in his first year wit
- Page 18 and 19:
With an extensive coaching backgrou
- Page 20 and 21:
Michael Christianson is in his firs
- Page 22 and 23:
A former NFL tight end, Reggie Davi
- Page 24 and 25:
With an extensive collegiate coachi
- Page 26 and 27:
Ejiro Evero (eeh-JEE-row EV-uh-row)
- Page 28 and 29:
Greg Jackson is in his first season
- Page 30 and 31:
John Morton is in his first year wi
- Page 32 and 33:
Mike Solari rejoined the 49ers in 2
- Page 34 and 35:
Jim Tomsula is in his fifth season
- Page 36 and 37:
Mark Uyeyama (ooh-ee-YAH-muh) is in
- Page 38 and 39:
PLAYERSPRONUNCIATIONNaVorro Bowman
- Page 40 and 41:
MARTZ, Mike - (Fresno State)Offensi
- Page 42 and 43:
Justin Chabot is in his eighth year
- Page 44 and 45:
Ethan Waugh is in his eighth year w
- Page 46 and 47:
Nate Breske is in his third year as
- Page 48 and 49:
Scott Rotier is in his fourth year
- Page 50 and 51:
QUARTERBACKS3 Scott Tolzien QB 6-3
- Page 52 and 53:
PLAYER BIO// CAREER HIGHLIGHTS• A
- Page 54 and 55:
PLAYER BIODAVID AKERS// 2001 (PHILA
- Page 56 and 57:
PLAYER BIODAVID AKERS2000 (Philadel
- Page 58 and 59:
PLAYER BIODAVID AKERS2009 (Philadel
- Page 60 and 61:
PLAYER BIO6-7 | 328 | OHIO ST. | 2N
- Page 62 and 63:
BOWMAN’S GAME-BY-GAMEPLAYER BIO20
- Page 64 and 65:
PLAYER BIO6-3 | 259 | VIRGINIA | 6T
- Page 66 and 67:
PLAYER BIOAHMAD BROOKS2006 (Cincinn
- Page 68 and 69:
PLAYER BIO// 2007• Suffered a tor
- Page 70 and 71:
PLAYER BIO6-4 | 264 | PITTSBURGH |
- Page 72 and 73:
PLAYER BIO6-1 | 235 | LAYFAYETTE |
- Page 74 and 75:
PLAYER BIO6-1 | 214 | TEXAS TECH |
- Page 76 and 77:
PLAYER BIO6-0 | 199 | SOUTH CAROLIN
- Page 78 and 79:
PLAYER BIO6-3 | 250 | MARYLAND | 6T
- Page 80 and 81:
PLAYER BIOVERNON DAVIS// COLLEGEFin
- Page 82 and 83:
PLAYER BIO6-1 | 233 | MISSISSIPPI S
- Page 84 and 85:
PLAYER BIO6-6 | 275 | GEORGIA | ROO
- Page 86 and 87:
PLAYER BIO// 2006 (CLEVELAND)• No
- Page 88 and 89:
PLAYER BIOBRAYLON EDWARDS2009 (Clev
- Page 90 and 91:
PLAYER BIO// COLLEGEA three-year le
- Page 92 and 93:
PLAYER BIOTED GINN JR.2009 Receivin
- Page 94 and 95:
PLAYER BIODASHON GOLDSON// PERSONAL
- Page 96 and 97:
PLAYER BIO6-1 | 242 | MIAMI | 4TH Y
- Page 98 and 99:
PLAYER BIO6-3 | 318 | MICHIGAN | 10
- Page 100 and 101:
PLAYER BIO5-9 | 217 | MIAMI | 7TH Y
- Page 102 and 103:
PLAYER BIOFRANK GORE// 2006• Name
- Page 104 and 105:
PLAYER BIO6-1 | 251 | OHIO ST. | 3R
- Page 106 and 107:
PLAYER BIO6-0 | 255 | TENNESSEE | 6
- Page 108 and 109:
PLAYER BIOPARYS HARALSON2008Date Op
- Page 110 and 111:
PLAYER BIO5-7 | 199 | OKLAHOMA ST |
- Page 112 and 113:
PLAYER BIO6-3 | 295 | LOUISIANA ST.
- Page 114 and 115:
PLAYER BIO6-5 | 242 | ARIZONA ST. |
- Page 116 and 117:
PLAYER BIO6-0 | 208 | TEXAS CHRISTI
- Page 118 and 119:
PLAYER BIO6-3 | 308 | APPALACHIAN S
- Page 120 and 121:
PLAYER BIO// 2007• Earned Pro Bow
- Page 122 and 123:
PLAYER BIOANDY LEE2009Date Opp W/L
- Page 124 and 125:
PLAYER BIO// COLLEGESaw action in 4
- Page 126 and 127:
PLAYER BIO6-2 | 248 | CENTRAL FLORI
- Page 128 and 129:
2008• All 3 of his receiving TDs
- Page 130 and 131:
PLAYER BIO6-1 | 250 | KANSAS | 11TH
- Page 132 and 133:
PLAYER BIOMORAN NORRISRushes: 3 (2
- Page 134 and 135:
PLAYER BIO6-4 | 299 | MONTANA ST. |
- Page 136 and 137:
PLAYER BIO6-0 | 192 | AUBURN | 7TH
- Page 138 and 139:
PLAYER BIOCARLOS ROGERS2008 (Washin
- Page 140 and 141:
PLAYER BIO6-4 | 217 | UTAH | 7TH YE
- Page 142 and 143:
PLAYER BIOALEX SMITH// INJURY REPOR
- Page 144 and 145:
PLAYER BIO6-4 | 285 | MISSOURI | 11
- Page 146 and 147:
PLAYER BIOJUSTIN SMITHTotal Tackles
- Page 148 and 149:
PLAYER BIO6-1 | 200 | OKLAHOMA | 4T
- Page 150 and 151:
PLAYER BIO6-6 | 325 | OREGON | 7TH
- Page 152 and 153:
PLAYER BIO6-2 | 330 | HAWAII | 8TH
- Page 154 and 155:
PLAYER BIOISAAC SOPOAGA2007Date Opp
- Page 156 and 157:
PLAYER BIO// 2005• Posted career-
- Page 158 and 159:
PLAYER BIO6-0 | 199 | MARSHALL | 3R
- Page 160 and 161:
PLAYER BIO6-5 | 315 | CENTRAL MICHI
- Page 162 and 163:
PLAYER BIO6-3 | 208 | WISCONSIN | R
- Page 164 and 165:
PLAYER BIOWILL TUKUAFUTUKUAFU’S C
- Page 166 and 167:
PLAYER BIODELANIE WALKER// COLLEGEB
- Page 168 and 169:
PLAYER BIO5-10 | 208 | OHIO ST. | 6
- Page 170 and 171:
PLAYER BIODONTE WHITNER2008 (Buffal
- Page 172 and 173:
PLAYER BIO5-10 | 186 | ARIZONA ST.
- Page 174 and 175:
PLAYER BIO6-1 | 203 | MARYLAND | 8T
- Page 176 and 177:
PLAYER BIOMADIEU WILLIAMS2004 (Cinc
- Page 178 and 179:
PLAYER BIO6-1 | 240 | MISSISSIPPI |
- Page 180 and 181:
PLAYER BIOPATRICK WILLIS// 2007•
- Page 182 and 183:
2010 IN REVIEWTEAM STATISTICSDate W
- Page 184 and 185:
2010 IN REVIEWPARTICIPATION CHARTSE
- Page 186 and 187:
2010 IN REVIEW1-1 Signed K Shane An
- Page 188 and 189:
2010 IN REVIEWOFFENSIVE TEAM STATSa
- Page 190 and 191:
2010 IN REVIEWGAME SUMMARIESGAME1Th
- Page 192 and 193:
2010 IN REVIEWGAME SUMMARIESGAME3Th
- Page 194 and 195:
2010 IN REVIEWGAME SUMMARIESGAME5Th
- Page 196 and 197:
2010 IN REVIEWGAME SUMMARIESGAME7Th
- Page 198 and 199:
2010 IN REVIEWGAME SUMMARIESGAME9Th
- Page 200 and 201:
2010 IN REVIEWGAME SUMMARIESGAME11M
- Page 202 and 203:
2010 IN REVIEWGAME SUMMARIESGAME13W
- Page 204 and 205:
2010 IN REVIEWGAME SUMMARIESGAME15W
- Page 206 and 207:
RECORDSMOST SEASONS PLAYEDPlayerSea
- Page 208 and 209:
RECORDSALL-TIME REGULAR SEASON SCOR
- Page 210 and 211:
TOP SINGLE-GAME PASSINGMOST PASSING
- Page 212 and 213:
RECORDSALL-TIME REGULAR SEASON RUSH
- Page 214 and 215:
RECORDSALL-TIME REGULAR SEASON RECE
- Page 216 and 217:
RECORDSALL-TIME REGULAR SEASON SCRI
- Page 218 and 219:
RECORDSALL-TIME SACK LEADERSPlayer
- Page 220 and 221:
RECORDSALL-TIME REGULAR SEASON KICK
- Page 222 and 223:
RECORDSNFL RECORDS HELD BY 49ERSMos
- Page 224 and 225:
RECORDSINDIVIDUAL RECORDSROOKIE SEA
- Page 226 and 227:
RECORDSCAREER 100-YARD RUSHING GAME
- Page 228 and 229:
RECORDS136 - Brian Westbrook at Arz
- Page 230 and 231:
RECORDS149 - Jerry Rice at NO 10/8/
- Page 232 and 233:
RECORDSALL-TIME BLOCKED FIELD GOALS
- Page 234 and 235:
RECORDSINDIVIDUAL RECORDS49ERS YEAR
- Page 236 and 237:
RECORDSKICKOFF RETURNS (BASED ON AV
- Page 238 and 239:
RECORDSINDIVIDUAL RECORDS49ERS YEAR
- Page 240 and 241:
RECORDSTEAM RECORDSSCORINGMost Poin
- Page 242 and 243:
RECORDSTEAM RECORDS49ERS SINGLE-GAM
- Page 244 and 245:
POSTSEASONHISTORY49ERS POSTSEASON H
- Page 246 and 247: POSTSEASONINDIVIDUAL RECORDS49ERS S
- Page 248 and 249: POSTSEASONTEAM RECORDS49ERS TEAM NF
- Page 250 and 251: 198149ers 38, New York Giants 24NFC
- Page 252 and 253: 198849ers 34, Minnesota Vikings 9NF
- Page 254 and 255: POSTSEASONGAME SUMMARIES1992Dallas
- Page 256 and 257: 199649ers 14, Philadelphia Eagles 0
- Page 258 and 259: 2001Green Bay Packers 25, 49ers 15N
- Page 260 and 261: ALL-TIME RESULTS1950 (3-9)Lawrence
- Page 262 and 263: ALL-TIME RESULTS1952 (7-5)Lawrence
- Page 264 and 265: ALL-TIME RESULTS1954 (7-4-1)Lawrenc
- Page 266 and 267: ALL-TIME RESULTS1956 (5-6-1)Frank C
- Page 268 and 269: ALL-TIME RESULTS1958 (6-6)Frank C.
- Page 270 and 271: ALL-TIME RESULTS1960 (7-5)Howard W.
- Page 272 and 273: ALL-TIME RESULTS1962 (6-8)Howard W.
- Page 274 and 275: ALL-TIME RESULTS1964 (4-10)Jack Chr
- Page 276 and 277: ALL-TIME RESULTSYEAR-BY-YEAR STATS1
- Page 278 and 279: ALL-TIME RESULTS1968 (7-6-1)Dick No
- Page 280 and 281: ALL-TIME RESULTS1970 (10-3-1/11-4-1
- Page 282 and 283: ALL-TIME RESULTS1972 (8-5-1/8-6-1)N
- Page 284 and 285: ALL-TIME RESULTS1974 (6-8)Dick Nola
- Page 286 and 287: ALL-TIME RESULTS1976 (8-6)Monte Cla
- Page 288 and 289: ALL-TIME RESULTSYEAR-BY-YEAR STATS1
- Page 290 and 291: ALL-TIME RESULTS1980 (6-10)Bill Wal
- Page 292 and 293: ALL-TIME RESULTS1982 (3-6)Bill Wals
- Page 294 and 295: ALL-TIME RESULTSYEAR-BY-YEAR STATS1
- Page 298 and 299: ALL-TIME RESULTS1988 (10-6/13-6)NFC
- Page 300 and 301: ALL-TIME RESULTSYEAR-BY-YEAR STATS1
- Page 302 and 303: ALL-TIME RESULTS1992 (14-2/15-3)NFC
- Page 304 and 305: ALL-TIME RESULTSYEAR-BY-YEAR STATS1
- Page 306 and 307: ALL-TIME RESULTSYEAR-BY-YEAR STATS1
- Page 308 and 309: ALL-TIME RESULTS1998 (12-4/13-5)Ste
- Page 310 and 311: ALL-TIME RESULTS2000 (6-10)Steve Ma
- Page 312 and 313: ALL-TIME RESULTS2002 (10-6/11-7)NFC
- Page 314 and 315: ALL-TIME RESULTSYEAR-BY-YEAR STATS2
- Page 316 and 317: ALL-TIME RESULTS2006 (7-9)Mike Nola
- Page 318 and 319: ALL-TIME RESULTSYEAR-BY-YEAR STATS2
- Page 320 and 321: ALL-TIME RESULTSYEAR-BY-YEAR STATS2
- Page 322 and 323: ALL-TIME RESULTSRECORD VS. OPPONENT
- Page 324 and 325: ALL-TIME RESULTSRECORD VS. OPPONENT
- Page 326 and 327: ALL-TIME RESULTSRECORD VS. OPPONENT
- Page 328 and 329: ALL-TIME RESULTSRECORD VS. OPPONENT
- Page 330 and 331: ALL-TIME RESULTSPRIMETIME GAMESPrim
- Page 332 and 333: ALL-TIME RESULTSMNF RECORDS49ERS MO
- Page 334 and 335: October 31, 1976St. Louis 23, San F
- Page 336 and 337: ALL-TIME RESULTSOVERTIME GAMESDecem
- Page 338 and 339: ALL-TIME RESULTSOVERTIME GAMESJanua
- Page 340 and 341: ALL-TIME RESULTSPRESEASON RESULTSPR
- Page 342 and 343: ALL-TIME RESULTSPRESEASON RESULTS19
- Page 344 and 345: ALL-TIME RESULTSNFC WEST STANDINGSN
- Page 346 and 347:
HISTORYSAN FRANCISCO 49ERSLIMITED P
- Page 348 and 349:
HISTORYGARRY NIVER AWARDThe Garry N
- Page 350 and 351:
HISTORY49ERS HALL OF FAMEEDWARD J.
- Page 352 and 353:
HISTORY49ERS HALL OF FAMEEDWARD J.
- Page 354 and 355:
HISTORYPRO BOWLERS1950 (JAN. 14, 19
- Page 356 and 357:
HISTORY1988 — Michael Carter NT (
- Page 358 and 359:
HISTORYUNRESTRICTED FREE AGENTS SIG
- Page 360 and 361:
1981QB Guy Benjamin from NO for 198
- Page 362 and 363:
HISTORYALL-TIME ROSTERALast First P
- Page 364 and 365:
HISTORYLast First Position College
- Page 366 and 367:
HISTORYALL-TIME ROSTERLast First Po
- Page 368 and 369:
HISTORYALL-TIME ROSTERLast First Po
- Page 370 and 371:
HISTORYLast First Position College
- Page 372 and 373:
HISTORY49ERS STARTERSLLB 55 Matt Ha
- Page 374 and 375:
HISTORY49ERS STARTERSLLB 52 Skip Va
- Page 376 and 377:
HISTORY49ERS STARTERSSS 46 Tim McDo
- Page 378 and 379:
1949December 10, the NFL and AAFC a
- Page 380 and 381:
HISTORYHISTORICAL HIGHLIGHTSship an
- Page 382 and 383:
HISTORYHISTORICAL HIGHLIGHTSstill m
- Page 384 and 385:
HISTORYHISTORICAL HIGHLIGHTScareer
- Page 386 and 387:
HISTORYHISTORICAL HIGHLIGHTSyards o
- Page 388 and 389:
HISTORYPRESIDENTS/PERSONNELSAN FRAN
- Page 390 and 391:
DRAFT HISTORYALL-TIME DRAFT1953(Jan
- Page 392 and 393:
DRAFT HISTORYALL-TIME DRAFT13. Greg
- Page 394 and 395:
DRAFT HISTORYALL-TIME DRAFT9. Choic
- Page 396:
DRAFT HISTORYALL-TIME DRAFT7. Choic