- Page 2 and 3:
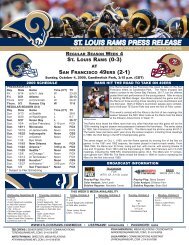
2011 SAN FRANCISCO 49ERS SCHEDULE &
- Page 4 and 5:
OFFICE OF THE OWNERDenise DeBartolo
- Page 6 and 7:
CO-CHAIRMENDENISE & JOHN YORKIn rec
- Page 8 and 9:
Trent Baalke enters his seventh sea
- Page 10 and 11:
Jeff Ferguson is in his sixth year
- Page 12 and 13:
Attack each day with an enthusiasm
- Page 14 and 15:
ALL-TIME 49ERS HEAD COACHING RECORD
- Page 16 and 17:
Greg Roman is in his first year wit
- Page 18 and 19:
With an extensive coaching backgrou
- Page 20 and 21:
Michael Christianson is in his firs
- Page 22 and 23:
A former NFL tight end, Reggie Davi
- Page 24 and 25:
With an extensive collegiate coachi
- Page 26 and 27:
Ejiro Evero (eeh-JEE-row EV-uh-row)
- Page 28 and 29:
Greg Jackson is in his first season
- Page 30 and 31:
John Morton is in his first year wi
- Page 32 and 33:
Mike Solari rejoined the 49ers in 2
- Page 34 and 35:
Jim Tomsula is in his fifth season
- Page 36 and 37:
Mark Uyeyama (ooh-ee-YAH-muh) is in
- Page 38 and 39:
PLAYERSPRONUNCIATIONNaVorro Bowman
- Page 40 and 41:
MARTZ, Mike - (Fresno State)Offensi
- Page 42 and 43:
Justin Chabot is in his eighth year
- Page 44 and 45:
Ethan Waugh is in his eighth year w
- Page 46 and 47:
Nate Breske is in his third year as
- Page 48 and 49:
Scott Rotier is in his fourth year
- Page 50 and 51:
QUARTERBACKS3 Scott Tolzien QB 6-3
- Page 52 and 53:
PLAYER BIO// CAREER HIGHLIGHTS• A
- Page 54 and 55:
PLAYER BIODAVID AKERS// 2001 (PHILA
- Page 56 and 57:
PLAYER BIODAVID AKERS2000 (Philadel
- Page 58 and 59:
PLAYER BIODAVID AKERS2009 (Philadel
- Page 60 and 61:
PLAYER BIO6-7 | 328 | OHIO ST. | 2N
- Page 62 and 63:
BOWMAN’S GAME-BY-GAMEPLAYER BIO20
- Page 64 and 65:
PLAYER BIO6-3 | 259 | VIRGINIA | 6T
- Page 66 and 67:
PLAYER BIOAHMAD BROOKS2006 (Cincinn
- Page 68 and 69:
PLAYER BIO// 2007• Suffered a tor
- Page 70 and 71:
PLAYER BIO6-4 | 264 | PITTSBURGH |
- Page 72 and 73:
PLAYER BIO6-1 | 235 | LAYFAYETTE |
- Page 74 and 75:
PLAYER BIO6-1 | 214 | TEXAS TECH |
- Page 76 and 77:
PLAYER BIO6-0 | 199 | SOUTH CAROLIN
- Page 78 and 79:
PLAYER BIO6-3 | 250 | MARYLAND | 6T
- Page 80 and 81:
PLAYER BIOVERNON DAVIS// COLLEGEFin
- Page 82 and 83:
PLAYER BIO6-1 | 233 | MISSISSIPPI S
- Page 84 and 85:
PLAYER BIO6-6 | 275 | GEORGIA | ROO
- Page 86 and 87:
PLAYER BIO// 2006 (CLEVELAND)• No
- Page 88 and 89:
PLAYER BIOBRAYLON EDWARDS2009 (Clev
- Page 90 and 91:
PLAYER BIO// COLLEGEA three-year le
- Page 92 and 93:
PLAYER BIOTED GINN JR.2009 Receivin
- Page 94 and 95:
PLAYER BIODASHON GOLDSON// PERSONAL
- Page 96 and 97:
PLAYER BIO6-1 | 242 | MIAMI | 4TH Y
- Page 98 and 99:
PLAYER BIO6-3 | 318 | MICHIGAN | 10
- Page 100 and 101:
PLAYER BIO5-9 | 217 | MIAMI | 7TH Y
- Page 102 and 103:
PLAYER BIOFRANK GORE// 2006• Name
- Page 104 and 105:
PLAYER BIO6-1 | 251 | OHIO ST. | 3R
- Page 106 and 107:
PLAYER BIO6-0 | 255 | TENNESSEE | 6
- Page 108 and 109:
PLAYER BIOPARYS HARALSON2008Date Op
- Page 110 and 111:
PLAYER BIO5-7 | 199 | OKLAHOMA ST |
- Page 112 and 113:
PLAYER BIO6-3 | 295 | LOUISIANA ST.
- Page 114 and 115:
PLAYER BIO6-5 | 242 | ARIZONA ST. |
- Page 116 and 117:
PLAYER BIO6-0 | 208 | TEXAS CHRISTI
- Page 118 and 119:
PLAYER BIO6-3 | 308 | APPALACHIAN S
- Page 120 and 121:
PLAYER BIO// 2007• Earned Pro Bow
- Page 122 and 123:
PLAYER BIOANDY LEE2009Date Opp W/L
- Page 124 and 125:
PLAYER BIO// COLLEGESaw action in 4
- Page 126 and 127:
PLAYER BIO6-2 | 248 | CENTRAL FLORI
- Page 128 and 129:
2008• All 3 of his receiving TDs
- Page 130 and 131:
PLAYER BIO6-1 | 250 | KANSAS | 11TH
- Page 132 and 133:
PLAYER BIOMORAN NORRISRushes: 3 (2
- Page 134 and 135:
PLAYER BIO6-4 | 299 | MONTANA ST. |
- Page 136 and 137:
PLAYER BIO6-0 | 192 | AUBURN | 7TH
- Page 138 and 139:
PLAYER BIOCARLOS ROGERS2008 (Washin
- Page 140 and 141:
PLAYER BIO6-4 | 217 | UTAH | 7TH YE
- Page 142 and 143:
PLAYER BIOALEX SMITH// INJURY REPOR
- Page 144 and 145:
PLAYER BIO6-4 | 285 | MISSOURI | 11
- Page 146 and 147:
PLAYER BIOJUSTIN SMITHTotal Tackles
- Page 148 and 149:
PLAYER BIO6-1 | 200 | OKLAHOMA | 4T
- Page 150 and 151:
PLAYER BIO6-6 | 325 | OREGON | 7TH
- Page 152 and 153:
PLAYER BIO6-2 | 330 | HAWAII | 8TH
- Page 154 and 155:
PLAYER BIOISAAC SOPOAGA2007Date Opp
- Page 156 and 157:
PLAYER BIO// 2005• Posted career-
- Page 158 and 159:
PLAYER BIO6-0 | 199 | MARSHALL | 3R
- Page 160 and 161:
PLAYER BIO6-5 | 315 | CENTRAL MICHI
- Page 162 and 163:
PLAYER BIO6-3 | 208 | WISCONSIN | R
- Page 164 and 165:
PLAYER BIOWILL TUKUAFUTUKUAFU’S C
- Page 166 and 167:
PLAYER BIODELANIE WALKER// COLLEGEB
- Page 168 and 169:
PLAYER BIO5-10 | 208 | OHIO ST. | 6
- Page 170 and 171:
PLAYER BIODONTE WHITNER2008 (Buffal
- Page 172 and 173:
PLAYER BIO5-10 | 186 | ARIZONA ST.
- Page 174 and 175:
PLAYER BIO6-1 | 203 | MARYLAND | 8T
- Page 176 and 177:
PLAYER BIOMADIEU WILLIAMS2004 (Cinc
- Page 178 and 179:
PLAYER BIO6-1 | 240 | MISSISSIPPI |
- Page 180 and 181:
PLAYER BIOPATRICK WILLIS// 2007•
- Page 182 and 183:
2010 IN REVIEWTEAM STATISTICSDate W
- Page 184 and 185:
2010 IN REVIEWPARTICIPATION CHARTSE
- Page 186 and 187:
2010 IN REVIEW1-1 Signed K Shane An
- Page 188 and 189:
2010 IN REVIEWOFFENSIVE TEAM STATSa
- Page 190 and 191:
2010 IN REVIEWGAME SUMMARIESGAME1Th
- Page 192 and 193:
2010 IN REVIEWGAME SUMMARIESGAME3Th
- Page 194 and 195:
2010 IN REVIEWGAME SUMMARIESGAME5Th
- Page 196 and 197:
2010 IN REVIEWGAME SUMMARIESGAME7Th
- Page 198 and 199:
2010 IN REVIEWGAME SUMMARIESGAME9Th
- Page 200 and 201:
2010 IN REVIEWGAME SUMMARIESGAME11M
- Page 202 and 203:
2010 IN REVIEWGAME SUMMARIESGAME13W
- Page 204 and 205:
2010 IN REVIEWGAME SUMMARIESGAME15W
- Page 206 and 207:
RECORDSMOST SEASONS PLAYEDPlayerSea
- Page 208 and 209:
RECORDSALL-TIME REGULAR SEASON SCOR
- Page 210 and 211:
TOP SINGLE-GAME PASSINGMOST PASSING
- Page 212 and 213:
RECORDSALL-TIME REGULAR SEASON RUSH
- Page 214 and 215:
RECORDSALL-TIME REGULAR SEASON RECE
- Page 216 and 217:
RECORDSALL-TIME REGULAR SEASON SCRI
- Page 218 and 219:
RECORDSALL-TIME SACK LEADERSPlayer
- Page 220 and 221:
RECORDSALL-TIME REGULAR SEASON KICK
- Page 222 and 223:
RECORDSNFL RECORDS HELD BY 49ERSMos
- Page 224 and 225:
RECORDSINDIVIDUAL RECORDSROOKIE SEA
- Page 226 and 227:
RECORDSCAREER 100-YARD RUSHING GAME
- Page 228 and 229:
RECORDS136 - Brian Westbrook at Arz
- Page 230 and 231:
RECORDS149 - Jerry Rice at NO 10/8/
- Page 232 and 233:
RECORDSALL-TIME BLOCKED FIELD GOALS
- Page 234 and 235:
RECORDSINDIVIDUAL RECORDS49ERS YEAR
- Page 236 and 237:
RECORDSKICKOFF RETURNS (BASED ON AV
- Page 238 and 239:
RECORDSINDIVIDUAL RECORDS49ERS YEAR
- Page 240 and 241:
RECORDSTEAM RECORDSSCORINGMost Poin
- Page 242 and 243:
RECORDSTEAM RECORDS49ERS SINGLE-GAM
- Page 244 and 245:
POSTSEASONHISTORY49ERS POSTSEASON H
- Page 246 and 247:
POSTSEASONINDIVIDUAL RECORDS49ERS S
- Page 248 and 249:
POSTSEASONTEAM RECORDS49ERS TEAM NF
- Page 250 and 251:
198149ers 38, New York Giants 24NFC
- Page 252 and 253: 198849ers 34, Minnesota Vikings 9NF
- Page 254 and 255: POSTSEASONGAME SUMMARIES1992Dallas
- Page 256 and 257: 199649ers 14, Philadelphia Eagles 0
- Page 258 and 259: 2001Green Bay Packers 25, 49ers 15N
- Page 260 and 261: ALL-TIME RESULTS1950 (3-9)Lawrence
- Page 262 and 263: ALL-TIME RESULTS1952 (7-5)Lawrence
- Page 264 and 265: ALL-TIME RESULTS1954 (7-4-1)Lawrenc
- Page 266 and 267: ALL-TIME RESULTS1956 (5-6-1)Frank C
- Page 268 and 269: ALL-TIME RESULTS1958 (6-6)Frank C.
- Page 270 and 271: ALL-TIME RESULTS1960 (7-5)Howard W.
- Page 272 and 273: ALL-TIME RESULTS1962 (6-8)Howard W.
- Page 274 and 275: ALL-TIME RESULTS1964 (4-10)Jack Chr
- Page 276 and 277: ALL-TIME RESULTSYEAR-BY-YEAR STATS1
- Page 278 and 279: ALL-TIME RESULTS1968 (7-6-1)Dick No
- Page 280 and 281: ALL-TIME RESULTS1970 (10-3-1/11-4-1
- Page 282 and 283: ALL-TIME RESULTS1972 (8-5-1/8-6-1)N
- Page 284 and 285: ALL-TIME RESULTS1974 (6-8)Dick Nola
- Page 286 and 287: ALL-TIME RESULTS1976 (8-6)Monte Cla
- Page 288 and 289: ALL-TIME RESULTSYEAR-BY-YEAR STATS1
- Page 290 and 291: ALL-TIME RESULTS1980 (6-10)Bill Wal
- Page 292 and 293: ALL-TIME RESULTS1982 (3-6)Bill Wals
- Page 294 and 295: ALL-TIME RESULTSYEAR-BY-YEAR STATS1
- Page 296 and 297: ALL-TIME RESULTSYEAR-BY-YEAR STATS1
- Page 298 and 299: ALL-TIME RESULTS1988 (10-6/13-6)NFC
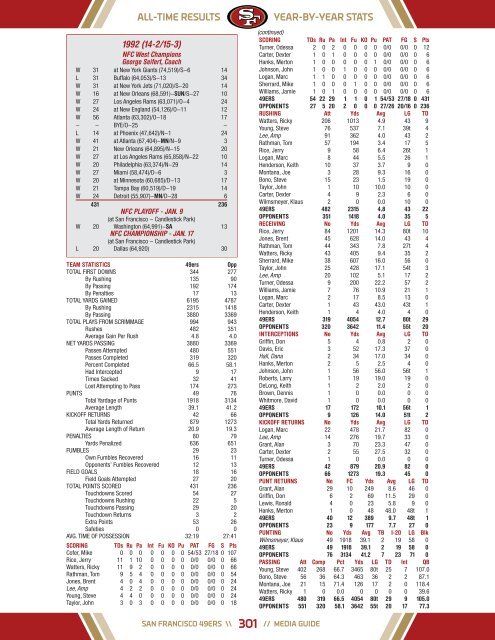
- Page 300 and 301: ALL-TIME RESULTSYEAR-BY-YEAR STATS1
- Page 304 and 305: ALL-TIME RESULTSYEAR-BY-YEAR STATS1
- Page 306 and 307: ALL-TIME RESULTSYEAR-BY-YEAR STATS1
- Page 308 and 309: ALL-TIME RESULTS1998 (12-4/13-5)Ste
- Page 310 and 311: ALL-TIME RESULTS2000 (6-10)Steve Ma
- Page 312 and 313: ALL-TIME RESULTS2002 (10-6/11-7)NFC
- Page 314 and 315: ALL-TIME RESULTSYEAR-BY-YEAR STATS2
- Page 316 and 317: ALL-TIME RESULTS2006 (7-9)Mike Nola
- Page 318 and 319: ALL-TIME RESULTSYEAR-BY-YEAR STATS2
- Page 320 and 321: ALL-TIME RESULTSYEAR-BY-YEAR STATS2
- Page 322 and 323: ALL-TIME RESULTSRECORD VS. OPPONENT
- Page 324 and 325: ALL-TIME RESULTSRECORD VS. OPPONENT
- Page 326 and 327: ALL-TIME RESULTSRECORD VS. OPPONENT
- Page 328 and 329: ALL-TIME RESULTSRECORD VS. OPPONENT
- Page 330 and 331: ALL-TIME RESULTSPRIMETIME GAMESPrim
- Page 332 and 333: ALL-TIME RESULTSMNF RECORDS49ERS MO
- Page 334 and 335: October 31, 1976St. Louis 23, San F
- Page 336 and 337: ALL-TIME RESULTSOVERTIME GAMESDecem
- Page 338 and 339: ALL-TIME RESULTSOVERTIME GAMESJanua
- Page 340 and 341: ALL-TIME RESULTSPRESEASON RESULTSPR
- Page 342 and 343: ALL-TIME RESULTSPRESEASON RESULTS19
- Page 344 and 345: ALL-TIME RESULTSNFC WEST STANDINGSN
- Page 346 and 347: HISTORYSAN FRANCISCO 49ERSLIMITED P
- Page 348 and 349: HISTORYGARRY NIVER AWARDThe Garry N
- Page 350 and 351: HISTORY49ERS HALL OF FAMEEDWARD J.
- Page 352 and 353:
HISTORY49ERS HALL OF FAMEEDWARD J.
- Page 354 and 355:
HISTORYPRO BOWLERS1950 (JAN. 14, 19
- Page 356 and 357:
HISTORY1988 — Michael Carter NT (
- Page 358 and 359:
HISTORYUNRESTRICTED FREE AGENTS SIG
- Page 360 and 361:
1981QB Guy Benjamin from NO for 198
- Page 362 and 363:
HISTORYALL-TIME ROSTERALast First P
- Page 364 and 365:
HISTORYLast First Position College
- Page 366 and 367:
HISTORYALL-TIME ROSTERLast First Po
- Page 368 and 369:
HISTORYALL-TIME ROSTERLast First Po
- Page 370 and 371:
HISTORYLast First Position College
- Page 372 and 373:
HISTORY49ERS STARTERSLLB 55 Matt Ha
- Page 374 and 375:
HISTORY49ERS STARTERSLLB 52 Skip Va
- Page 376 and 377:
HISTORY49ERS STARTERSSS 46 Tim McDo
- Page 378 and 379:
1949December 10, the NFL and AAFC a
- Page 380 and 381:
HISTORYHISTORICAL HIGHLIGHTSship an
- Page 382 and 383:
HISTORYHISTORICAL HIGHLIGHTSstill m
- Page 384 and 385:
HISTORYHISTORICAL HIGHLIGHTScareer
- Page 386 and 387:
HISTORYHISTORICAL HIGHLIGHTSyards o
- Page 388 and 389:
HISTORYPRESIDENTS/PERSONNELSAN FRAN
- Page 390 and 391:
DRAFT HISTORYALL-TIME DRAFT1953(Jan
- Page 392 and 393:
DRAFT HISTORYALL-TIME DRAFT13. Greg
- Page 394 and 395:
DRAFT HISTORYALL-TIME DRAFT9. Choic
- Page 396:
DRAFT HISTORYALL-TIME DRAFT7. Choic