- Page 1 and 2:
IFEAT INTERNATIONAL CONFERENCE 2012
- Page 3 and 4:
CONTENTSPREFACEvRavi Sanganeria, Ch
- Page 5:
IFEAT BUSINESS 283IFEAT Annual Repo
- Page 8 and 9:
On the last day of the conference,
- Page 11 and 12:
A VIEW OF MENTHOL DEVELOPMENT- FROM
- Page 13 and 14:
There is a highly educated workforc
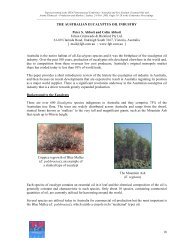
- Page 15 and 16:
eturn, say, mint, in this case. In
- Page 17 and 18:
By 2001, mint production had declin
- Page 19 and 20:
Uttar Pradesh (UP)UP is India’s m
- Page 21:
Mint ProductionThe graph illustrate
- Page 25 and 26:
The table provides an example of th
- Page 27 and 28:
RECENT TRENDS AND FUTURE CHALLENGES
- Page 29 and 30:
Compared to the giants in synthetic
- Page 31:
THANK YOU &HAVE A NICE DAY!Mr "Gats
- Page 34 and 35:
An intriguing element of this myste
- Page 36 and 37:
This will produce significant, if u
- Page 38 and 39:
Rising UrbanizationIndia has 70% of
- Page 40 and 41:
Systemic Drivers for Sectoral Growt
- Page 42 and 43:
LuxuryIndia’s luxury market is st
- Page 44 and 45:
Growth Projection of F&F MarketOver
- Page 46 and 47:
The rewards for those who innovate,
- Page 48 and 49:
&!!"%#!"!"#$%&'()##)*+',-'.'%!!"$#!
- Page 50 and 51:
Within the total area of 2.94 milli
- Page 52 and 53:
The methodologies include training
- Page 54 and 55:
• Protective microorganisms• Na
- Page 56 and 57:
Figure 18 : Centritherm - Thin Film
- Page 59 and 60:
S. Palaniswamy RajaJasmine C. E. Pv
- Page 61 and 62:
Such cultivation and use of flowers
- Page 63 and 64:
The floral fragrance products in th
- Page 65 and 66:
(b) Sambac(b)SambacJasminum sambac
- Page 67 and 68:
(d) Mimosa(d)MimosaAcacia mearnsii
- Page 69:
FUTUREBesides the long tradition, t
- Page 72 and 73:
Geographically the state is divided
- Page 74 and 75:
This table below shows the volume o
- Page 76 and 77:
Main ConstituentsThe main constitue
- Page 78 and 79:
INDIAN CALAMUS OILThe botanical nam
- Page 80 and 81:
TAGETES OILThe botanical name is Ta
- Page 82 and 83:
JUNIPER BERRY OILThe botanical name
- Page 84 and 85:
Odour ProfileBalsamic, woody, herba
- Page 86 and 87:
This oil is one important component
- Page 88 and 89:
Various improvements in the cultiva
- Page 91 and 92:
CHINA’S FLAVOUR AND FRAGRANCE IND
- Page 93 and 94:
In my presentation today I intend t
- Page 95 and 96:
These figures show theproportionate
- Page 97 and 98:
Enterprises have to pay close atten
- Page 99 and 100:
OVERVIEW OF THE CHINESE GUM TURPENT
- Page 101 and 102:
The abundant pine forests in China
- Page 103 and 104:
Chinese GT Industry PerspectiveOleo
- Page 105 and 106:
faded out, which was equivalent to
- Page 107 and 108:
The GT derivatives industry has bee
- Page 109 and 110:
Acknowledgements• Mr. Lin Like, P
- Page 111 and 112:
ANETHOLE DEVELOPMENT TRENDSHuang Zo
- Page 113 and 114:
INDUSTRIAL PRODUCTION OF ANETHOLEAn
- Page 115 and 116:
hydrate (KOH), then anethole is gai
- Page 117 and 118:
output of anethole is calculated to
- Page 119 and 120:
price and supply of synthetic helio
- Page 121 and 122:
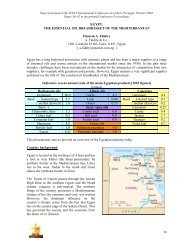
!!!!!!!!!!!THE ESSENTIAL OIL INDUST
- Page 123 and 124:
!!"#$%&'(')%*+,-(((The graphs below
- Page 125 and 126:
Pepper OilPepper, which is known as
- Page 127 and 128:
15Crop production: 2,700 mtOil expo
- Page 129 and 130:
vated as a mono crop in the Central
- Page 131 and 132:
distillation units there are 135 fi
- Page 133 and 134:
MAJOR CHALLENGES IN THE INDUSTRYTho
- Page 135 and 136:
THE FLAVOUR AND FRAGRANCE INDUSTRY
- Page 137 and 138:
THANK YOU!!!!!!!!!!!!!!!!!!!!!!!!!!
- Page 139 and 140:
INTRODUCTIONOVERVIEW OF THE AGARWOO
- Page 141 and 142:
AQUILARIA SPECIES PRODUCES AGARWOOD
- Page 143 and 144:
RESINOUS COMPOUNDSSome of these che
- Page 145 and 146:
OIL QUALITY GRADINGCurrently, there
- Page 147 and 148:
VALUE ADDITIONIN THE INDONESIAN FLA
- Page 149 and 150:
!"#$$%&'%()*&)+#$,%)-..*&'))!""#$%&
- Page 151 and 152:
MARKETING TRENDS OF AMBIENT SCENTIN
- Page 153 and 154:
Our fragrance partner is Drom with
- Page 155 and 156:
Hong KongHong Kong is the home to t
- Page 157 and 158:
Sustainability and Market Issues149
- Page 159 and 160:
INTRODUCTIONSUSTAINABLE SUPPLYA CON
- Page 161 and 162:
The internet age has dramatically c
- Page 163 and 164:
Similarly, our customers want to kn
- Page 165 and 166:
A critical part of Performance with
- Page 167 and 168:
Earlier I talked about how our bran
- Page 169 and 170:
INTRODUCTIONEFFORTS AND CHALLENGES
- Page 171 and 172:
The following table provides an ove
- Page 173 and 174:
price has recovered to normal andpr
- Page 175 and 176:
The activities of the patchouli pil
- Page 177 and 178:
CONCLUSIONSIn conclusion, consideri
- Page 179 and 180:
THE INGREDIENTS SUPPLY CHAIN:PAST A
- Page 181 and 182:
HOW HAVE BUYERS AND SUPPLIERS CONNE
- Page 183 and 184:
Let’s take a look at a few of the
- Page 185 and 186:
Illustrative example of a total ind
- Page 187 and 188:
ERP solution is provided as well as
- Page 189 and 190:
Traceability from the origin and ve
- Page 191 and 192:
Those who embrace this new dynamic
- Page 193 and 194:
New Sources of Natural Ingredient S
- Page 195 and 196:
AROMA CHEMICALS FROM THE TROPICS VI
- Page 197 and 198:
FROM BIOMATERIALS TO OLEOCHEMICALSB
- Page 199 and 200:
Bioconversion of coconut oil to est
- Page 201 and 202:
Shao Quan LIU is an Assistant Profe
- Page 203 and 204:
BIOTECHNOLOGY AND THE CHANGING ROLE
- Page 205 and 206:
Why is this so important to us? How
- Page 207 and 208:
and in the San Francisco Bay area (
- Page 209 and 210:
The tools that have been developed
- Page 211 and 212:
CAN BIO-SYNTHETIC BIOLOGY BE THE NE
- Page 213 and 214:
!"#$"%&'(#)(*+,%(-&.%,+(*%$&contain
- Page 215 and 216:
!"#$%&'(')*+",-.*/+01&')&23".4.56'7
- Page 217 and 218:
small additive, wherein you could h
- Page 219 and 220: And you can see that any of these c
- Page 221 and 222: Dr. P M Murali, is the Managing Dir
- Page 223 and 224: Regulatory Issues215
- Page 225 and 226: THE SOCIO-ECONOMIC IMPORTANCE OF TH
- Page 227 and 228: The issues affecting the fragrance
- Page 229 and 230: THE IFRA SOCIO-ECONOMIC ANALYSIS PR
- Page 231 and 232: So we have taken this grid, and est
- Page 233 and 234: The data have been broken down betw
- Page 235 and 236: Nevertheless, it’s the SCCS, so D
- Page 237 and 238: wolf: “Ah we can’t do anything,
- Page 239 and 240: The process would be to start from
- Page 241 and 242: I will not bore you with all of the
- Page 243 and 244: REACH: AN UPDATE OF EFEO’S PROGRA
- Page 245 and 246: Based on the 2005 survey 47 NCSs ar
- Page 247 and 248: Therefore, all manufacturers and su
- Page 249 and 250: As a result of EFEO’s phase-2 ini
- Page 251 and 252: EXPERIENCESThe data requirements fo
- Page 253 and 254: • exposure and risk assessment•
- Page 255 and 256: EFEO - THE FIRST DECADE AND BEYONDP
- Page 257 and 258: !"#$%&'()&*!+,&-($)#.&/&"*,!(0.& .1
- Page 259 and 260: !"#$%&'($")*$)&+&,+%-.!/)• '""$0"
- Page 261 and 262: Country and Other Studies253
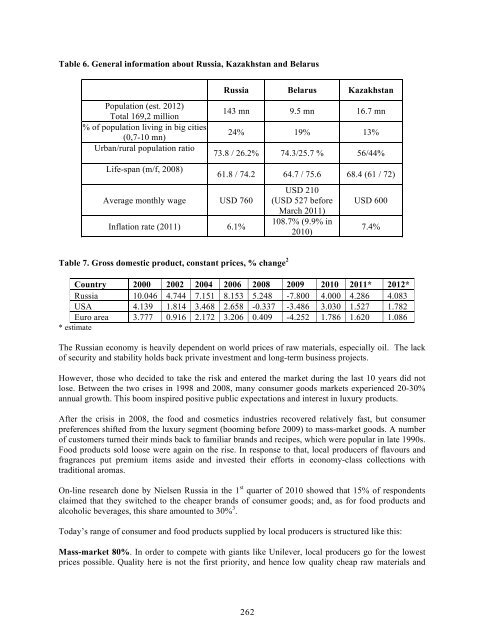
- Page 263 and 264: THE FLAVOUR AND FRAGRANCE INDUSTRY
- Page 265 and 266: Major business activity is still co
- Page 267 and 268: Important service provided by local
- Page 269: F&F BUYERS - DOMESTIC MARKETIn the
- Page 273 and 274: Household chemicalsSince the late 1
- Page 275 and 276: Consumers’ habits are also changi
- Page 277 and 278: Alcoholic beveragesThe most popular
- Page 279 and 280: BIBLIOGRAPHY1. http://www.gks.ru/fr
- Page 281 and 282: IMPROVED IDENTIFICATION METHODS FOR
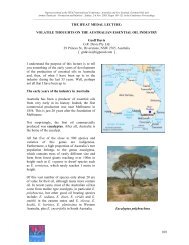
- Page 283 and 284: Australian aboriginals have used th
- Page 285 and 286: Another interesting point is thenum
- Page 287 and 288: perform a chiral test on these comp
- Page 289 and 290: If you are buying oil in 185 kgs st
- Page 291 and 292: IFEAT Business283
- Page 293 and 294: IFEAT ANNUAL REPORT 2011Ramon Borda
- Page 295 and 296: INTRODUCTIONICATS / PLYMOUTH UNIVER
- Page 297 and 298: A key ICATS activity, supported by
- Page 299 and 300: REPORT ON THE 2012BRITISH SOCIETY O
- Page 301 and 302: As the course progresses, flavour c
- Page 303 and 304: BRAZIL & PARAGUAY IFEAT STUDY TOUR
- Page 305 and 306: After the return of the boat, we dr
- Page 307 and 308: Saturday was one the highlights of
- Page 309 and 310: IFEAT 2013 SAN FRANCISCO CONFERENCE
- Page 311 and 312: The Fairmont has excellent dining f
- Page 313 and 314: VISASWhat is IFEAT proposing to do?
- Page 315 and 316: THE IFEAT 2013 STUDY TOUR TO SOUTH
- Page 317 and 318: Sunday 9th JuneParticipants arrive
- Page 319 and 320: Friday 14th June - Day 5Friday 14th
- Page 321 and 322:
Monday 17th June - Day 8In the morn
- Page 323 and 324:
INTRODUCTIONICATS INTERMEDIATE PERF
- Page 325 and 326:
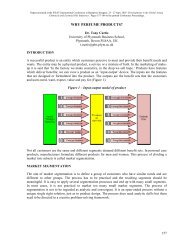
WHY FRAGRANCE PRODUCTS?There is onl
- Page 327 and 328:
In this paper for the conference pr
- Page 329 and 330:
FRAGRANCE CREATIONThis was a short