User's Manual - Cornell Lab of Ornithology - Cornell University
User's Manual - Cornell Lab of Ornithology - Cornell University
User's Manual - Cornell Lab of Ornithology - Cornell University

You also want an ePaper? Increase the reach of your titles
YUMPU automatically turns print PDFs into web optimized ePapers that Google loves.
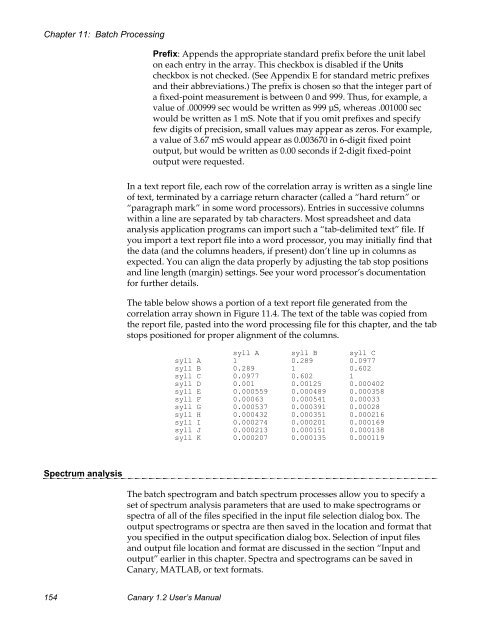
Chapter 11: Batch ProcessingPrefix: Appends the appropriate standard prefix before the unit labelon each entry in the array. This checkbox is disabled if the Unitscheckbox is not checked. (See Appendix E for standard metric prefixesand their abbreviations.) The prefix is chosen so that the integer part <strong>of</strong>a fixed-point measurement is between 0 and 999. Thus, for example, avalue <strong>of</strong> .000999 sec would be written as 999 µS, whereas .001000 secwould be written as 1 mS. Note that if you omit prefixes and specifyfew digits <strong>of</strong> precision, small values may appear as zeros. For example,a value <strong>of</strong> 3.67 mS would appear as 0.003670 in 6-digit fixed pointoutput, but would be written as 0.00 seconds if 2-digit fixed-pointoutput were requested.In a text report file, each row <strong>of</strong> the correlation array is written as a single line<strong>of</strong> text, terminated by a carriage return character (called a “hard return” or“paragraph mark” in some word processors). Entries in successive columnswithin a line are separated by tab characters. Most spreadsheet and dataanalysis application programs can import such a “tab-delimited text” file. Ifyou import a text report file into a word processor, you may initially find thatthe data (and the columns headers, if present) don’t line up in columns asexpected. You can align the data properly by adjusting the tab stop positionsand line length (margin) settings. See your word processor’s documentationfor further details.The table below shows a portion <strong>of</strong> a text report file generated from thecorrelation array shown in Figure 11.4. The text <strong>of</strong> the table was copied fromthe report file, pasted into the word processing file for this chapter, and the tabstops positioned for proper alignment <strong>of</strong> the columns.syll A syll B syll Csyll A 1 0.289 0.0977syll B 0.289 1 0.602syll C 0.0977 0.602 1syll D 0.001 0.00125 0.000402syll E 0.000559 0.000489 0.000358syll F 0.00063 0.000541 0.00033syll G 0.000537 0.000391 0.00028syll H 0.000432 0.000351 0.000216syll I 0.000274 0.000201 0.000169syll J 0.000213 0.000151 0.000138syll K 0.000207 0.000135 0.000119Spectrum analysisThe batch spectrogram and batch spectrum processes allow you to specify aset <strong>of</strong> spectrum analysis parameters that are used to make spectrograms orspectra <strong>of</strong> all <strong>of</strong> the files specified in the input file selection dialog box. Theoutput spectrograms or spectra are then saved in the location and format thatyou specified in the output specification dialog box. Selection <strong>of</strong> input filesand output file location and format are discussed in the section “Input andoutput” earlier in this chapter. Spectra and spectrograms can be saved inCanary, MATLAB, or text formats.154 Canary 1.2 User’s <strong>Manual</strong>